. 2020 May 26;9:e54903. doi: 10.7554/eLife.54903

Figure 1. Single cell transcriptomic analysis of P0 WT and Maf cDKO neocortex.

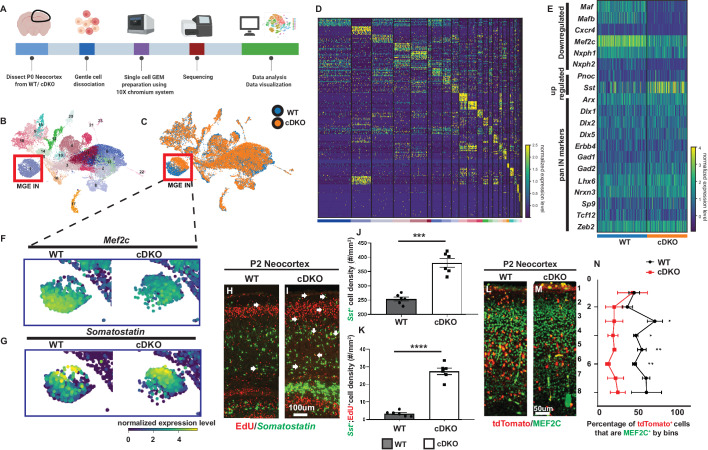
(A) Experimental design for 10X genomics analysis of the P0 WT and Maf cDKO neocortex. Neocortical tissues were dissociated for single cell gel bead-in-emulsion (GEMs) particle preparation, followed by cDNA library preparation, sequencing and data analysis. (B) UMAP plot of WT and cDKO cells, color coded with cluster identities (see Figure 1—figure supplement 2). (C) UMAP plot of WT and cDKO cells, color coded with genotypes; cluster one are MGE INs. Note the genotype separation of the cells in cluster 1 (left bottom), but not other clusters, suggesting the lack of non-cell autonomous effects of the cDKO. (D) Heatmap showing cluster identities with corresponding marker genes. (E) Heatmap of cluster 1 cells from WT and cDKO showing average expression of selected MGE IN markers and pan-IN markers. Note the nearly full depletion of Mafb and Maf and increased expression of Sst, and the decreased expression of Mef2c, while other MGE-derived IN markers such as Dlx1/2/5, Gad2 and Lhx6 were not changed. This suggests that the deletion of Mafs in the MGE-lineage does not lead to a gross change in MGE-derived IN fate. (F–G) Enlarged feature plots showing the expression of Mef2c (F) and Sst (G) from WT and cDKO from cluster 1. (H–I) FISH in Sst together with EdU labeling showing the amount of E15.5 born MGE-derived CINs that became Sst+ in WTs and cDKOs. Arrows point to the cells that are EdU+;Sst+. (J) Quantification of Sst+ CINs at P2 WT and cDKO neocortex. (K) Quantification of EdU+;Sst+ CINs at P2 WT and cDKO neocortex. (L–M) Immunofluorescent staining of MEF2C colocalized with Nkx2.1-cre-driven tdTomato reporter. P2 Maf cDKOs have decreased MEF2C expression (M) compared to WTs (L). (N) Quantification of the proportion of tdTomato+ CINs that were MEF2C+ by bins. N = 3–4 animals per group and multiple brain sections were used for quantification. Scale bar in (I) = 100 um and in (M) = 50 um. *p<0.05, **p<0.01, ***p<0.001, ****p<0.0001.

Figure 1—source data 1. Cluster marker gene list Here we provide a list of genes that were used to define each cluster’s identity.

Figure 1.

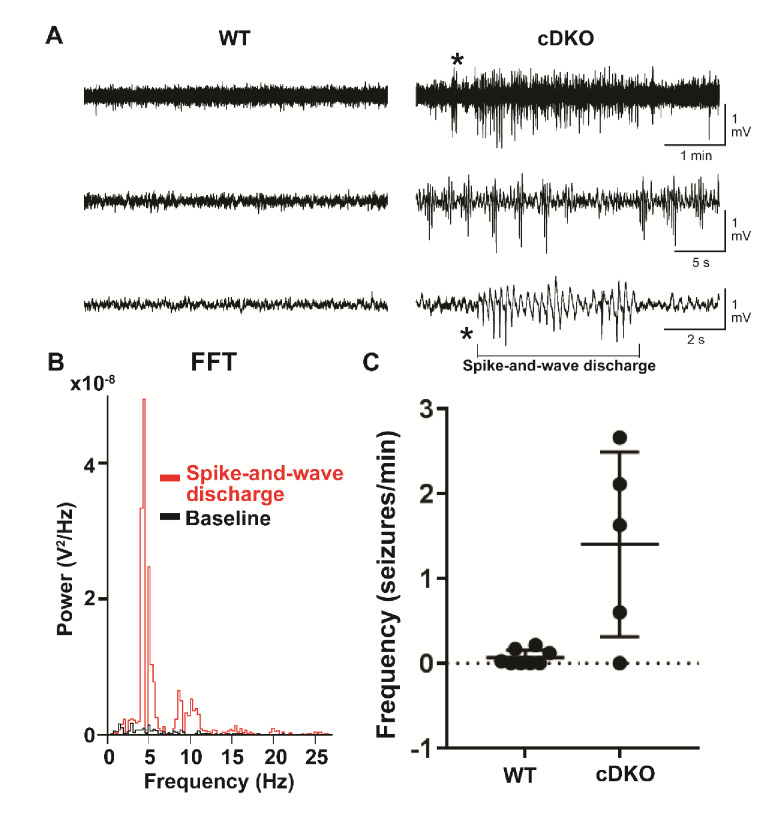
Figure 1—figure supplement 1. Adult Maf cDKO animals have spontaneous non-motor seizure activities.

Figure 1—figure supplement 1.

(A) Representative EEG recordings from freely behaving WT and Maf cDKO mice. Note the presence of epileptic discharges in the cDKO but not the WT mouse. The epileptic episode indicated by the asterisk was expanded in the bottom trace to illustrate the spike-and-wave discharge characteristic of typical absence type seizures. (B) Fast-Fourier transform of the spike-and-wave discharge (red) illustrated in panel (A), and the preceding baseline EEG activity (black). (C) Quantification of the frequency of epileptiform events in freely behaving WT (n = 7 mice) and cDKO (n = 5 mice) mice.
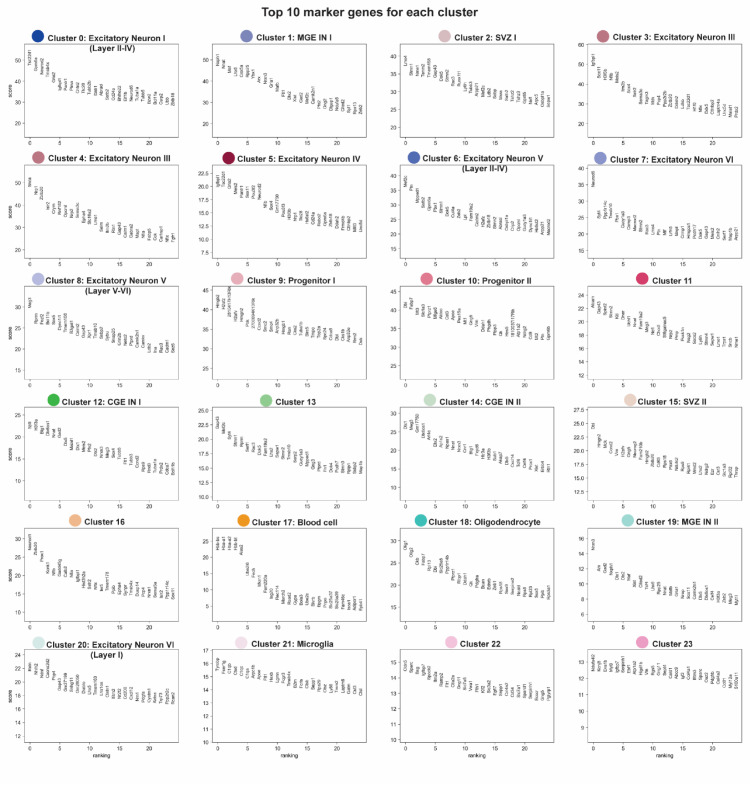
Figure 1—figure supplement 2. Top 10 ranked marker genes for each cluster.

Figure 1—figure supplement 2.

Each panel shows the cluster number, each cluster’s corresponding color that matched the cluster localization in Figure 1B, and each cluster’s top 10 ranked marker genes.
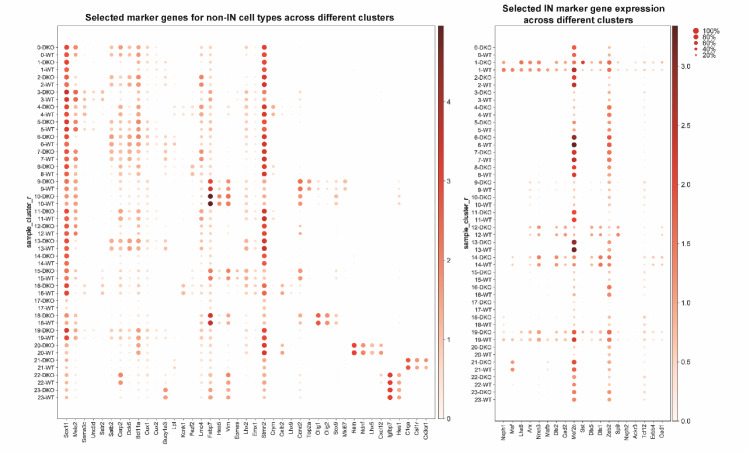
Figure 1—figure supplement 3. Dotplots of non-IN and IN population by selected marker genes.

Figure 1—figure supplement 3.

Dotplots showing non-IN population (left) and IN population (right) of WT and cDKO based upon selected marker genes. The darkness of the dot positively corresponds to gene expression level and the size of the dot corresponds to the proportion of the cells within each cluster that express specific marker genes.
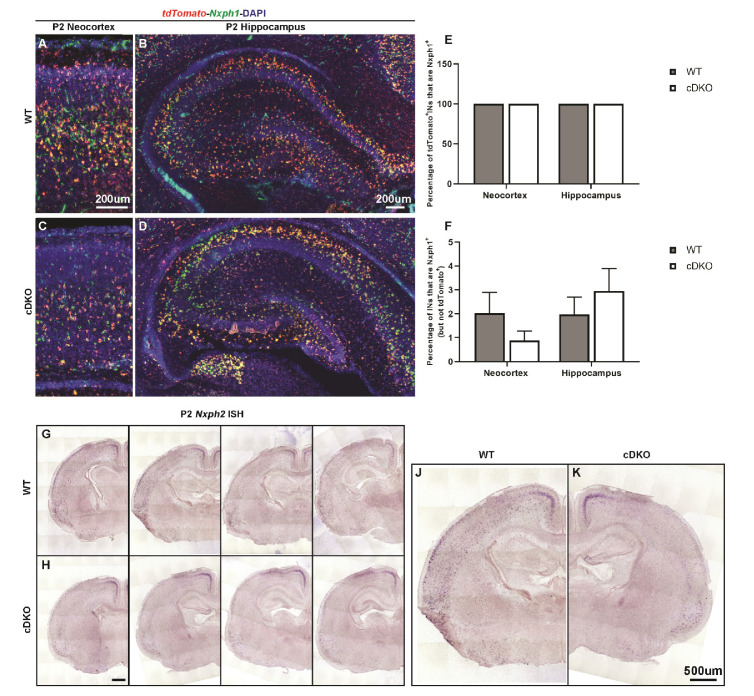
Figure 1—figure supplement 4. Nxph1-tdTomato double FISH and Nxph2 ISH.

Figure 1—figure supplement 4.

(A–D) Nxph1-tdTomato double FISH on P2 WT (A–B) and cDKO (C–D) neocortex/hippocampus. (E) Quantification of the percentage of tdTomato+ INs that were Nxph1+ by regions. (F) Quantification of the percentage of the Nxph1+ INs that were not tdTomato+ by regions. These data demonstrate the high specificity of Nxph1 labeling in the Nkx2.1-cre lineage. (G–K) Nxph2 ISH on P2 WT (G, J) and cDKO (H, K) brain sections. Note in the WT, Nxph2 labels a subset of INs both in the deep neocortex and in the hippocampus, and the expression of Nxph2 is diminished in the cDKO. Scale bar in (A) and (B) = 200 um; (H) and (K) = 500 um. N = 3–4 per groups.
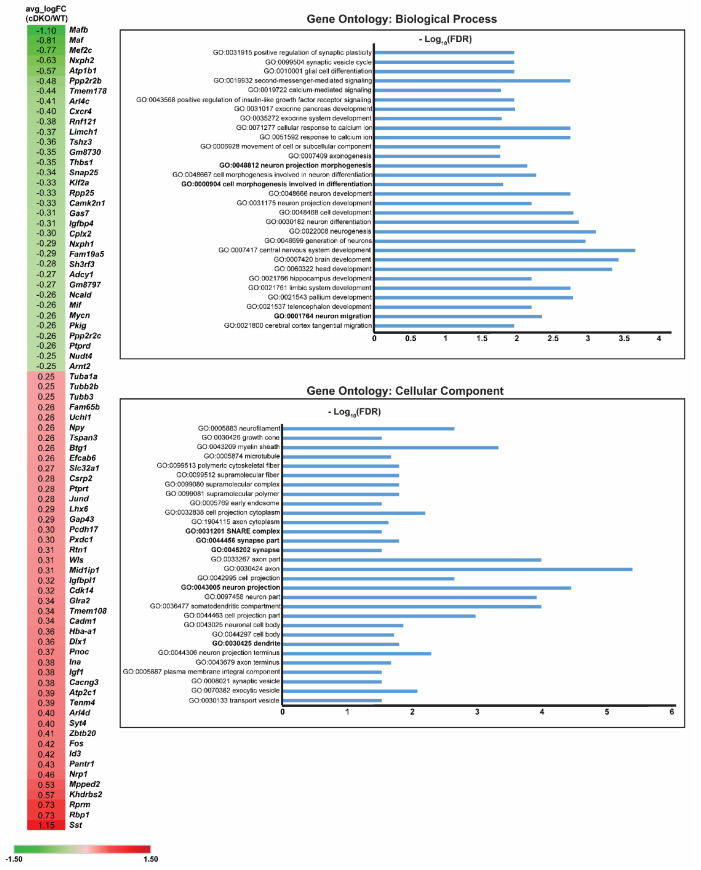
Figure 1—figure supplement 5. DEX gene list and Gene Ontology analysis on DEX genes Heatmap showing the DEX gene list of the MGE IN population (cluster 1) when compared cDKO to WT.

Figure 1—figure supplement 5.

(Left) Numbers listed corresponds to Log (FoldChange) values. Green color represents genes downregulated in the Maf cDKO, while red color represents genes upregulated in the Maf cDKO. (Right) Gene ontology analysis of the DEX genes based upon biological processes and cellular components.
Figure 1—figure supplement 6. Downregulation of Cxcr4 expression at E15.5 and P2 in the Maf cDKO.

Figure 1—figure supplement 6.

(A–B) double FISH of tdTomato and Cxcr4 on P2 WT (A) and cDKO (B) hippocampus. (C–H) Higher magnification images from WT and cDKO that show tdTomato and Cxcr4 expression in CA1 (C,F), CA3 (D,G) and DG (E, H). (I) Quantification of the tdTomato+;Cxcr4+ IN cell density in the neocortex. (J) Quantification of the tdTomato+;Cxcr4+ IN cell density in the hippocampus. (K) Quantification of the tdTomato+;Cxcr4+ HIN cell density by hippocampal regions. (L–O) double FISH of Lhx6 and Cxcr4 on E15.5 WT (L, N) and cDKO (M, O) hemispheres and higher magnification in neocortex. Arrows point to the Lhx6+ CINs that are Cxcr4+. (P) Quantification of the density of CINs that are Lhx6 and Cxcr4 double positive. (Q) Quantification of the proportion of Lhx6+ CINs that are Cxcr4+. Scale bar in (B) = 300 um, (H) and (O) = 100 um and (M) = 800 um. N = 3–4 per groups for the P2 experiment and N = 2 for the E15.5 experiment. *p<0.05, **p<0.01, ****p<0.0001. Cell density was compared using Welch’s t test while the proportion comparison was done using Mann-Whitney test.
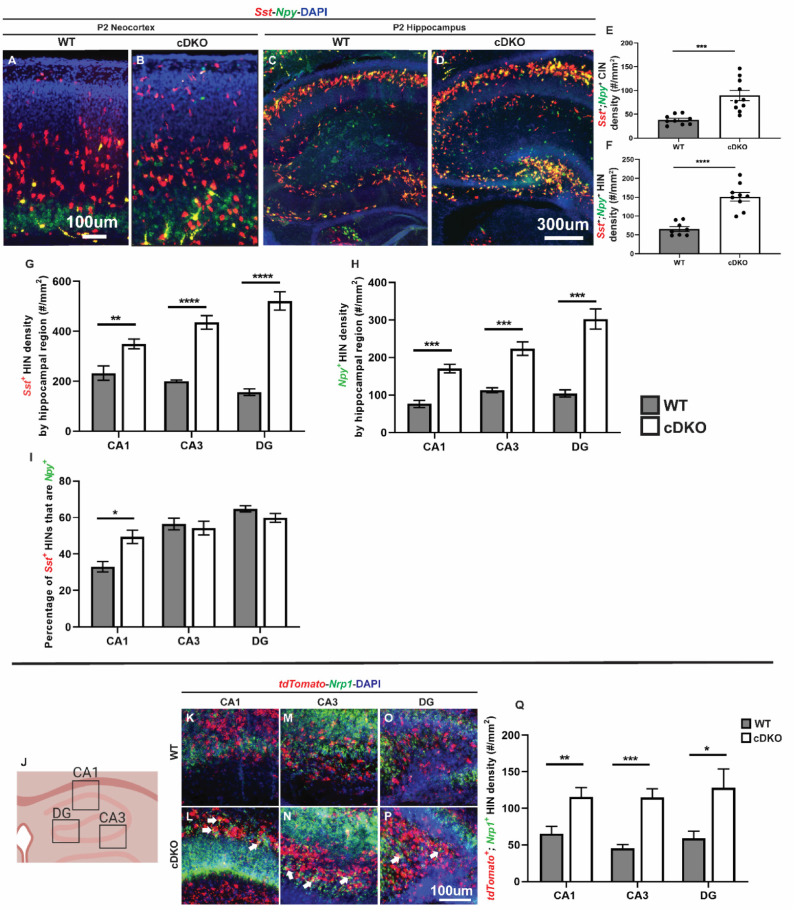
Figure 1—figure supplement 7. Maf cDKO has increased Sst+/Npy+/Nrp1+ expressing HINs.

Figure 1—figure supplement 7.

(A–B) Double FISH of Sst and Npy on P2 WT (A) and cDKO (B) neocortex. (C–D) Double FISH of Sst and Npy on P2 WT (C) and cDKO (D) hippocampus. (E–F) Quantification of the Npy+; Sst+ CIN density (E) and HIN density (F). (G–H) Quantification of the HINs that are either Sst+ or Npy+ by region. (I) Quantification of the percentage of Sst+ HINs that are Npy+ by region. (J) Cartoon schema illustrating the hippocampal regions used for quantification. (K–P) FISH images from P2 WT and cDKO that show tdTomato and Nrp1 expression in CA1 (K, L), CA3 (M, N) and DG (O, P). Arrows point to the tdTomato+ HINs that are Nrp1+. (Q) Quantification of the tdTomato+;Nrp1+ IN cell density by hippocampal regions. Note that the HINs in the pyramidal cell layer were excluded from the quantification. Scale bar in (A) and (P) = 100 um and (D) = 300 um. N = 3 per groups per experiment for analysis. *p<0.05, **p<0.01, ***p<0.001, ****p<0.0001. Cell density was compared using Welch’s t test while the proportion comparison was done using Mann-Whitney test.