
Figure 3. Multiplex RNA in situ hybridization validation of proposed immature PV IN markers.
(A) Heatmap of MGE IN marker genes for cluster 1 Sst- and Sst+ INs. (B–D’’) Lower magnification fluorescent images of multiplex RNA in situ hybridization for Mef2c (B–B’’), Sp9 (C–C’’) and Igfbp4 (D–D’’). (E–G’’’) Higher magnification fluorescent images of multiplex RNA in situ hybridization for Mef2c (E–E’’’), Sp9 (F–F’’’) and Igfbp4 (G–G’’’). White arrows point to INs that are marker (Mef2c, Sp9 or Igfbp4) and tdTomato positive but Sst negative. Violin plots showing the normalized expression value (Y-axis) of each cell analyzed in each group for Mef2c (H), Sp9 (J) and Igfbp4 (L). Quantification of the percentage of tdTomato+; Sst- and tdTomato+; Sst+ INs in the neocortex and in the hippocampus that are either Mef2c+(I), Sp9+(K) or Igfbp4+(M). Scale bar in (B) = 100 um, (B’’) = 200 um and (G) = 25 um. 2 WTs and multiple brain sections per animal were used for quantification. For statistical analysis, multiple independent t-tests without same standard deviation assumption were conducted to compare the expression of each gene in each brain region. *p<0.05, **p<0.01, ***p<0.001, ****p<0.0001.

Figure 3—figure supplement 1. Schema depicting the hypothesis behind candidate PV IN marker discovery In Pai et al., 2019, we fate-mapped the Sst-IRES-Cres lineage and discovered that > 90% of Sst-IRES-Cre labeled CINs remain to be SST-expressing in adulthood.
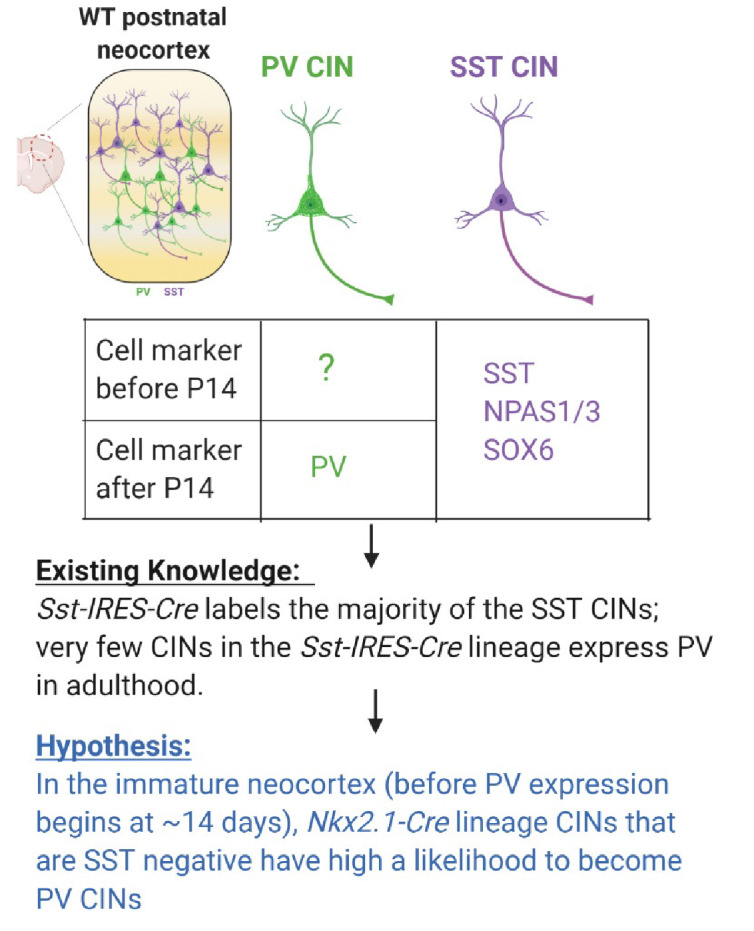
Figure 3—figure supplement 2. Multiplex RNA in situ hybridization validation of proposed immature PV IN markers.

Figure 3—figure supplement 3. Higher magnification view of HINs from multiplex fluorescent in situ hybridization.
