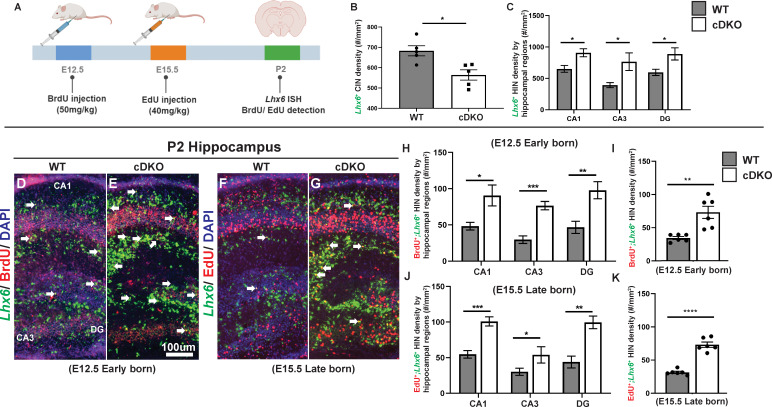
Figure 6. Maf cDKOs overproduce INs that will become HINs.
(A) Schema depicting the BrdU/EdU pulse-chase experiment. Briefly, BrdU was injected into a pregnant mouse at E12.5 and EdU was injected at E15.5. Neonatal pups were harvested at P2 analyzed for Lhx6/BrdU, Lhx6/EdU co-expression. (B) Quantification of Lhx6+ IN cell density in the P2 neocortex. (C) Quantification of Lhx6+ IN cell density in the P2 hippocampus by region. (D–G) Lhx6 FISH with BrdU (D-E, early-born) or EdU (F-G, late-born) co-labeling in P2 WT and cDKO hippocampus. (H–I) Quantification of the Lhx6+; BrdU+ IN cell density in the hippocampus by region (H) and in total (I). (J–K) Quantification of the Lhx6+; EdU+ IN cell density in the hippocampus by region (J) and in total (K). N = 3 per group and multiple sections were quantified per animal. Scale bar in (E) = 100 um. Welch’s t test.


