. 2020 Jun 9;9:e53367. doi: 10.7554/eLife.53367

Figure 5. FUCCI analysis of cell cycle progression.

(A) Live-cell imaging of the FUCCI biosensor proteins mVenus-hGeminin(1/110) and mCherry-hCdt1(30/120), stably expressed by the A549, NCI-H1573 and NCI-H358 cell lines. Images were taken every 20 min for 72 hr under control conditions, or following a cisplatin pulse (5 µg/mL, 2 hr) in the presence or absence of dactolisib (1 µM). (B) Quantification of the length of each cell cycle phase under each treatment condition (n = 17–175, mean ± SD). Statistical significance was determined by one-way ANOVA (****p<0.0001, ***p<0.001, **p<0.01, *p<0.05). (C) Quantification of fate of each cell; including G1 arrest before mitosis (G1 ABM), G1 arrest after mitosis (G1 AAM), death before mitosis (DBM) and death after mitosis (DAM). (D) Survival curves indicating the proportion of viable cells over time under each treatment condition.

Figure 5.

Figure 5—figure supplement 1. Representative images of cells expressing the FUCCI biosensor, undergoing an aberrant mitosis, G2 exit, Death before Mitosis (DBM) and Death after Mitosis (DAM) following a cisplatin pulse (5 μg/mL, 2 hr).

Figure 5—figure supplement 1.

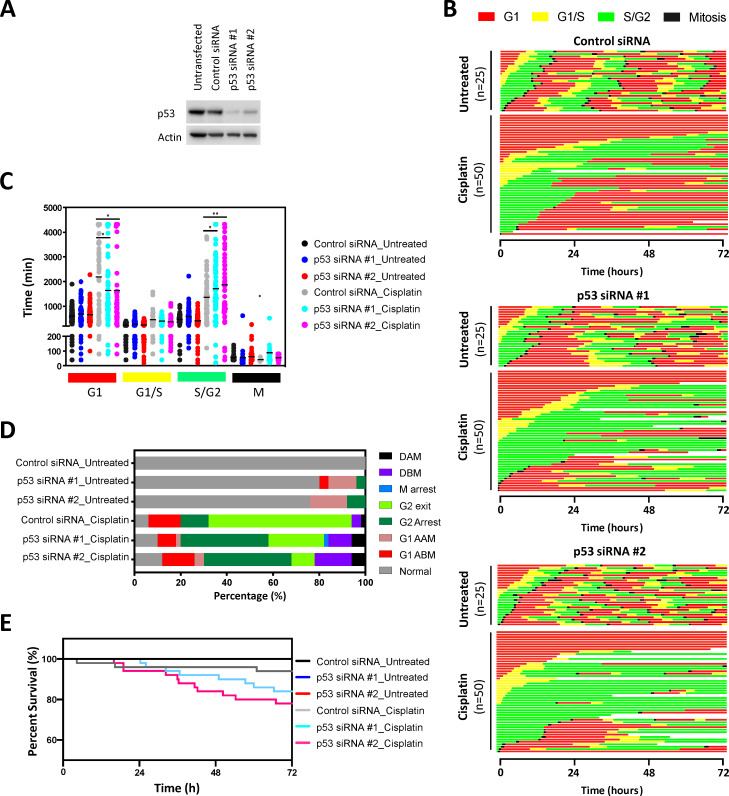
Figure 5—figure supplement 2. FUCCI analysis following p53 knockdown.

Figure 5—figure supplement 2.

(A) Western blot confirming specific knockdown of p53 with two different siRNAs. (B) Live-cell imaging of the FUCCI biosensor proteins mVenus-hGeminin(1/110) and mCherry-hCdt1(30/120), stably expressed by the A549 cell line following 48 hr treatment with control or p53 targeting siRNA, as indicated. Images were taken every 20 min for 72 hr under control conditions, or following a cisplatin pulse (5 μg/mL, 2 hr). (C) Quantification of the length of each cell cycle phase under each treatment condition. Statistical significance was determined by one-way ANOVA (****p<0.0001, ***p<0.001, **p<0.01, *p<0.05). (D) Quantification of fate of each cell; including G1 arrest before mitosis (G1 ABM), G1 arrest after mitosis (G1 AAM), death before mitosis (DBM) and death after mitosis (DAM). (E) Survival curves indicating the proportion of viable cells over time under each treatment condition.
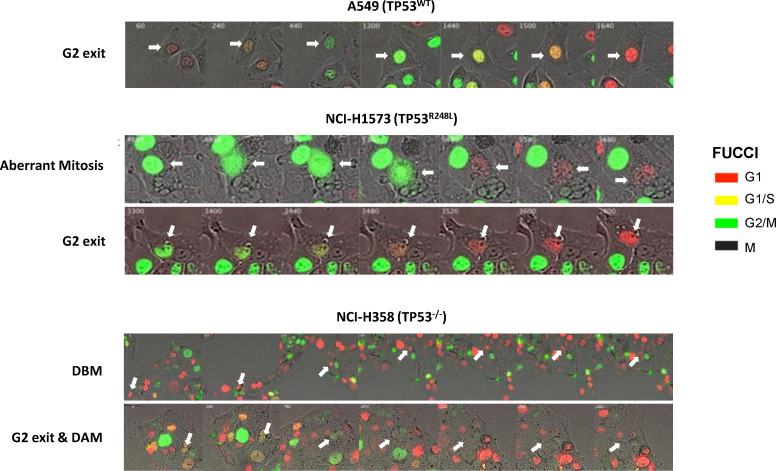
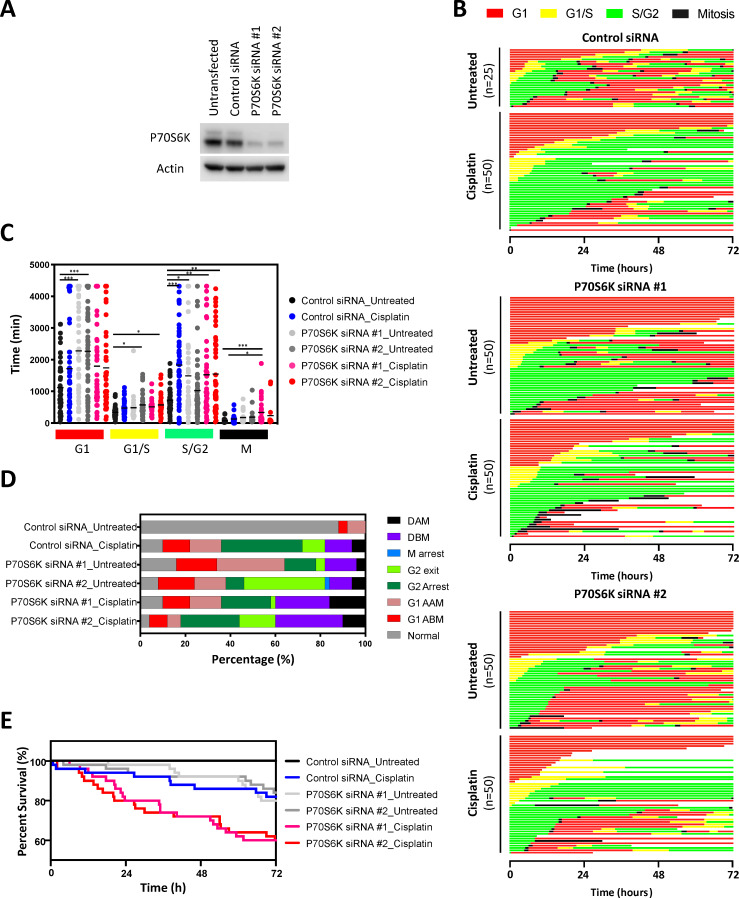
Figure 5—figure supplement 3. FUCCI analysis following P70S6K knockdown.

Figure 5—figure supplement 3.

(A) Western blot confirming specific knockdown of P70S6K with two different siRNAs. (B) Live-cell imaging of the FUCCI biosensor proteins mVenus-hGeminin(1/110) and mCherry-hCdt1(30/120), stably expressed by the NCI-H358 cell line following 48 hr treatment with control or P70S6K targeting siRNA, as indicated. Images were taken every 20 min for 72 hr under control conditions, or following a cisplatin pulse (5 μg/mL, 2 hr) in the presence or absence of dactolisib (1 μM). (C) Quantification of the length of each cell cycle phase under each treatment condition (n = 17–175, mean ± SD). Statistical significance was determined by one-way ANOVA (****p<0.0001, ***p<0.001, **p<0.01, *p<0.05). (D) Quantification of fate of each cell; including G1 arrest before mitosis (G1 ABM), G1 arrest after mitosis (G1 AAM), death before mitosis (DBM) and death after mitosis (DAM). (E) Survival curves indicating the proportion of viable cells over time under each treatment condition.