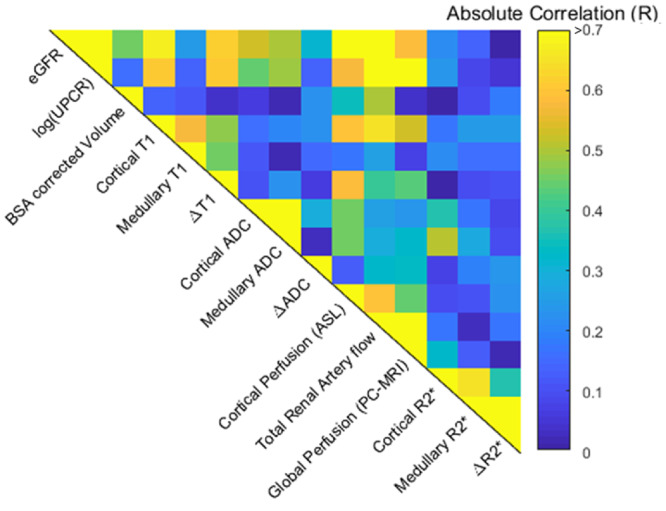
FIGURE 3.

Correlation matrix for combined HV and CKD groups of biochemical measures [eGFR and log(UPCR)] and multi-parametric MRI measures. Significant correlations of MRI measures with biochemical measures are shown in Figure 4. Between the multi-parametric MRI measures, significant correlations are observed between cortical T1 and cortical perfusion (R = −0.595, P < 0.001), total renal artery blood flow (R = −0.655, P < 0.001), global perfusion (R = −0.435, P = 0.001); between T1 CMD (ΔT1) and cortical perfusion (R = −0.587, P < 0.001) and total renal artery blood flow (R = −0.397, P = 0.05). Correlations are also seen between cortical ADC and cortical perfusion (R = 0.452 P = 0.02). Between haemodynamic measures, significant correlations were observed between cortical perfusion and total renal artery flow (R = 0.596, P = 0.002), and cortical perfusion and global perfusion (R = 0.44, P = 0.04).
