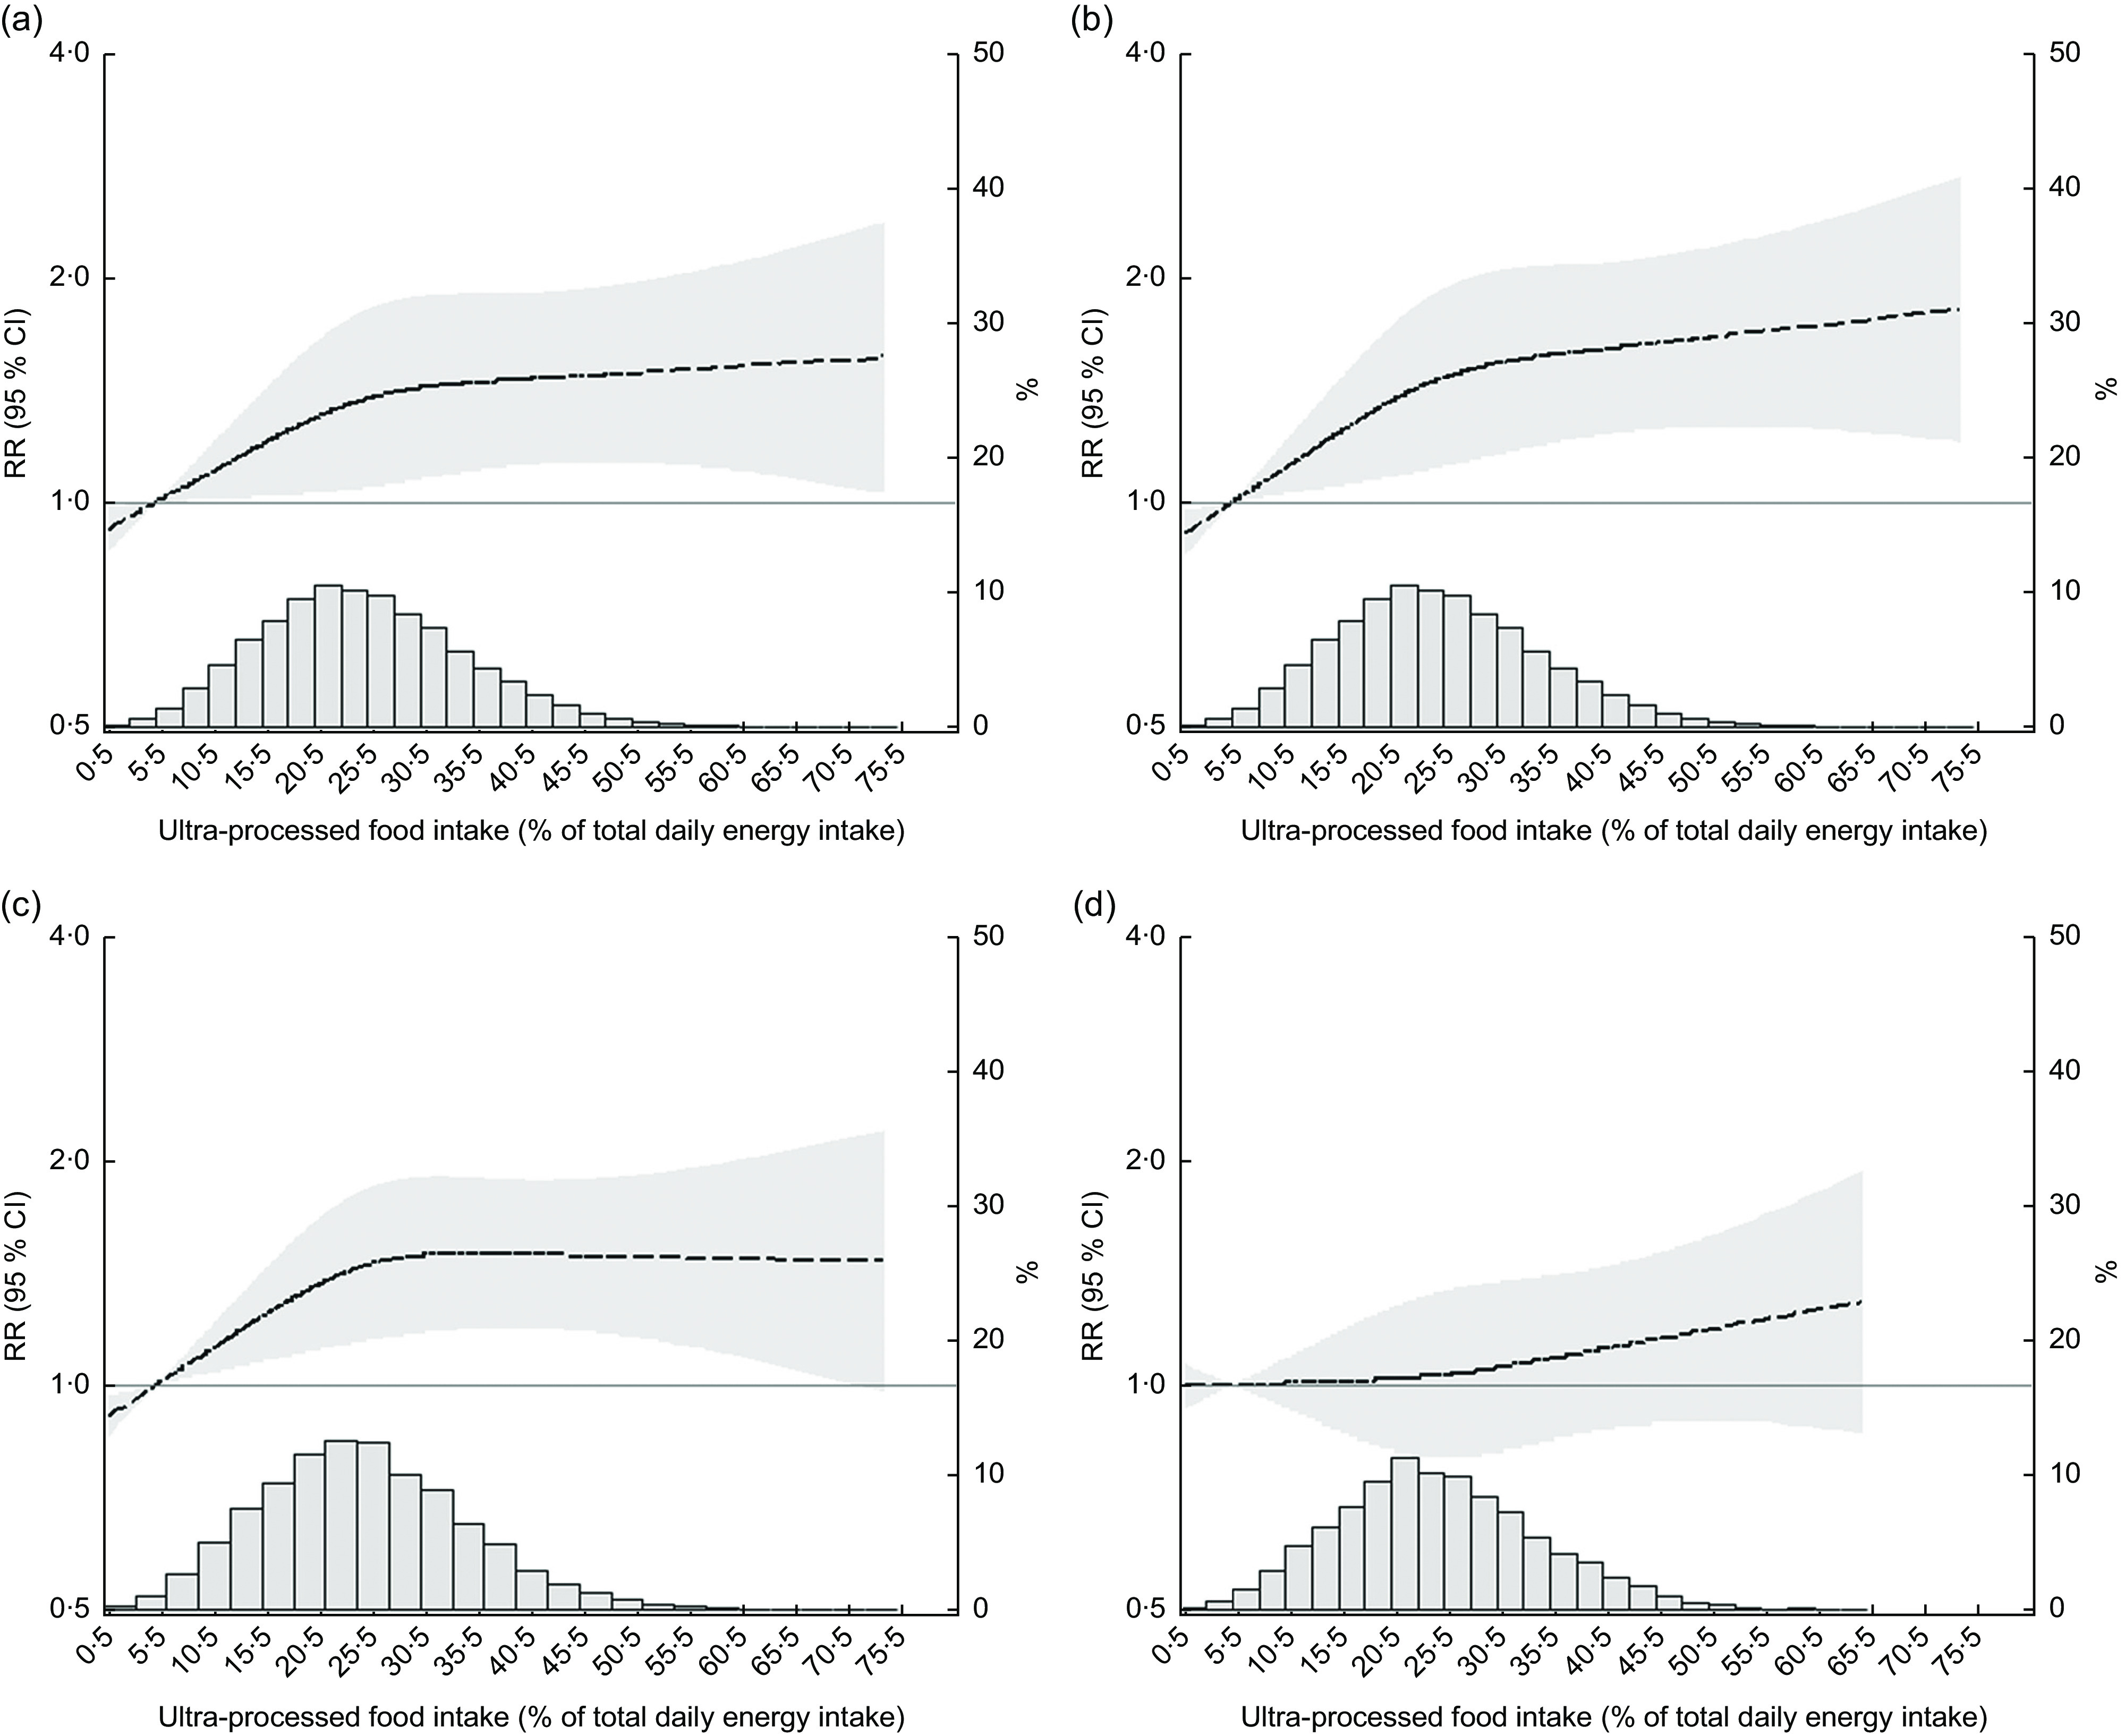
Fig. 2.

Associations ( , relative risk (RR);
  , 95 % CI) of increasing intake of ultra-processed foods with (a) a major weight gain (≥90th percentile; ≥1·7 kg/year), (b) a major waist gain (≥90th percentile; ≥2·4 cm/year), (c) incident overweight or obesity among those without excess weight at baseline and (d) incident obesity among those overweight at baseline, after a mean 3·8-year follow-up. Brazilian Longitudinal Study of Adult Health (ELSA-Brasil), 2008–2010 (n 11 827). Associations were obtained through restricted cubic spline analyses adjusted for age, sex, colour/race, school achievement, per capita family income, smoking, physical activity and baseline waist (for waist gain) or BMI (for weight gain, incident overweight and obesity and incident obesity among those overweight). The y-axis to the right of each plot indicates the relative frequency (%) of the ultra-processed food intake displayed in the superimposed distribution curve
