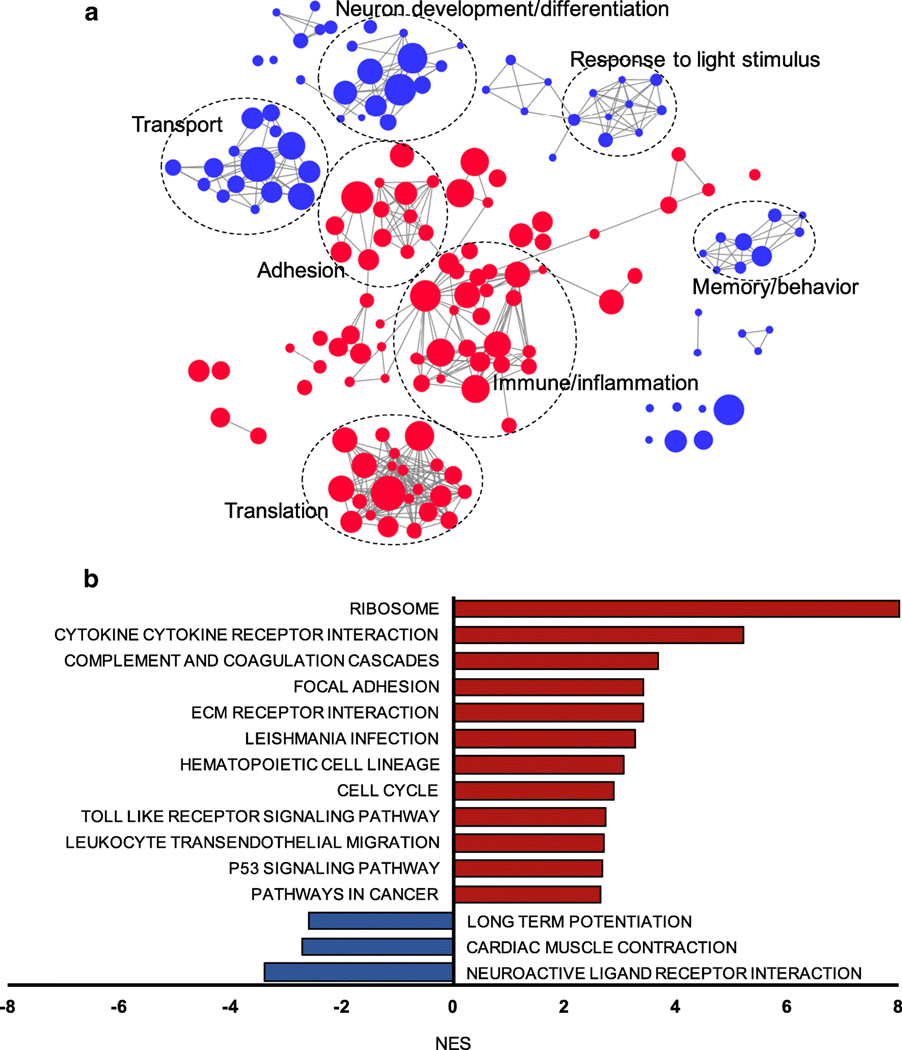
Fig. 7.
Coordinated changes in gene expression associated with functions/pathways are identifiable in early-stage FCG. a Enrichment map based on the GSEA results of GO biological processes was generated using Enrichmentmap plug-in for Cytoscape. Red nodes represent genesets that are positively enriched and over-represented in the ONH in early FCG, while blue nodes represent genesets that are negatively enriched and under-represented. Node size is proportional to the size of the functional GO term gene sets. Only gene sets that were enriched with FDR < 0.001 and the top 100 enriched GO biological processes (both upregulated and downregulated) in FCG are depicted. Genesets with common biological function are grouped by cluster and are labeled with representative functions. b Significantly up- (FDR < 0.001) and downregulated KEGG pathways in FCG (FDR < 0.05) support many cellular and molecular mechanisms previously implicated in glaucoma pathogenesis. Red bars represent significantly upregulated KEGG pathways, whereas blue bars represent downregulated KEGG pathways

