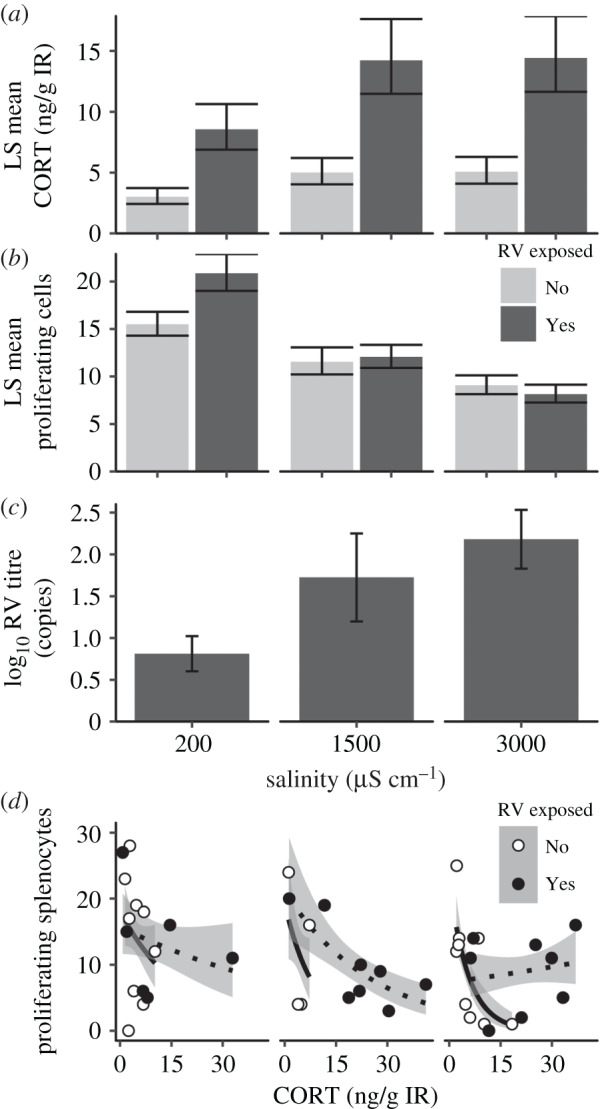
Figure 3.

Stress and immune responses of naive larvae reared in road salt-treated water in a laboratory experiment at 6 d post-exposure (n = 20 per salinity/exposure group; exposed to 105 pfu ml−1: RV+; or mock exposed: RV−). (a) LS mean interrenal corticosterone (CORT) levels (±s.e.m., n = 10) accounting for developmental stage effects (b) LS mean proliferating splenocyte counts (±s.e.m., n = 6–10) accounting for spleen size and (c) positive log10 ranavirus titres in gastrointestinal (GI) tissue (n = 6–8). In (a–c), dark and light bars represent ranavirus-exposed and unexposed, respectively. (d) The relationship between proliferating splenocyte count and corticosterone levels across salinity (divided plots corresponding to x-axis of (a–c) and ranavirus treatments (n = 4–9). Lines represent best-fit Poisson regressions with white points and solid lines representing RV unexposed, and black points and dotted lines representing ranavirus exposed.
