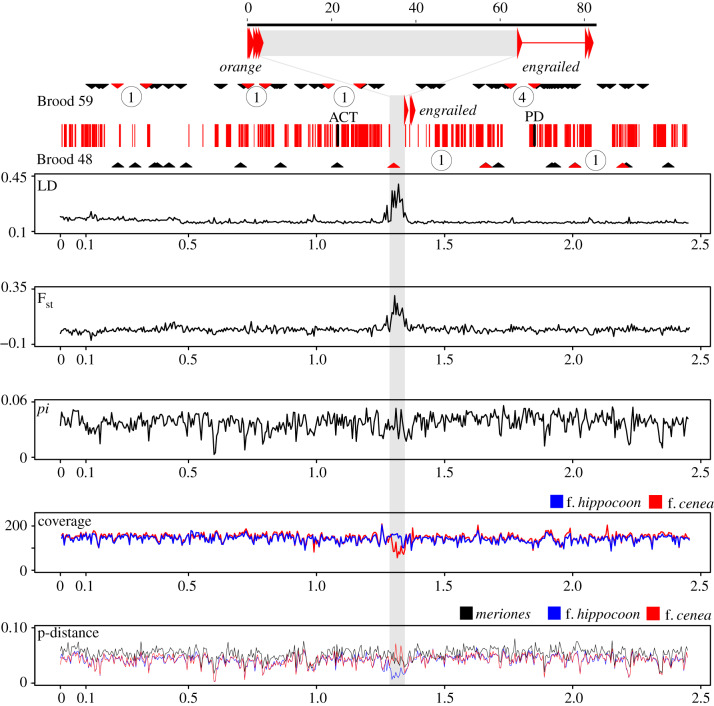
Figure 2.
Population genomic analysis of the full engrailed–invected containing scaffold. The exons of orange and engrailed are shown by large arrows and the upstream region marked in grey. Brood 59 and Brood 48: recombination events in pedigree broods. SNPs from RADseq data for two broods are mapped on the engrailed–invected scaffold, shown by black triangles. Red triangles mark the intervals with confirmed recombination events, and the number of recombination events within these intervals are circled. The central band in the figure shows the map of the scaffold with exons (thin vertical red lines) and the upstream region of engrailed (grey). ACT and PD indicate the position of the AFLP markers of [16]. Linkage disequilibrium (LD; Kelly's ZnS statistic), Fst, nucleotide diversity (pi), coverage and p-distance (to the reference genome) for the scaffold, calculated for the f. cenea and f. hippocoonides samples in 5 kb windows. Coverage and p-distance were calculated separately for the four cenea and for four hippocoonides specimens. The p-distance to the reference genome is also given for the P. dardanus meriones sample. Scales are in million base pairs. (Online version in colour.)

