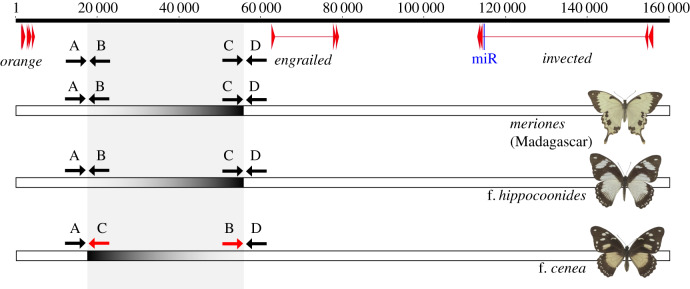
Figure 3.
Length and relative position of the inversions in the upstream regulatory region of engrailed. At the top, the map of the engrailed–invected region is shown, with short arrows indicating exons and miR-2768 [39] shown in blue. Below the map is the direction of boundary-defining primers. The grey shading indicates the extent of the 40 kb inversion associated with f. cenea. For each of the forms, dark grey–light grey shading is used to indicate directionality of the 40 kb region. Scale is in base pair. (Online version in colour.)

