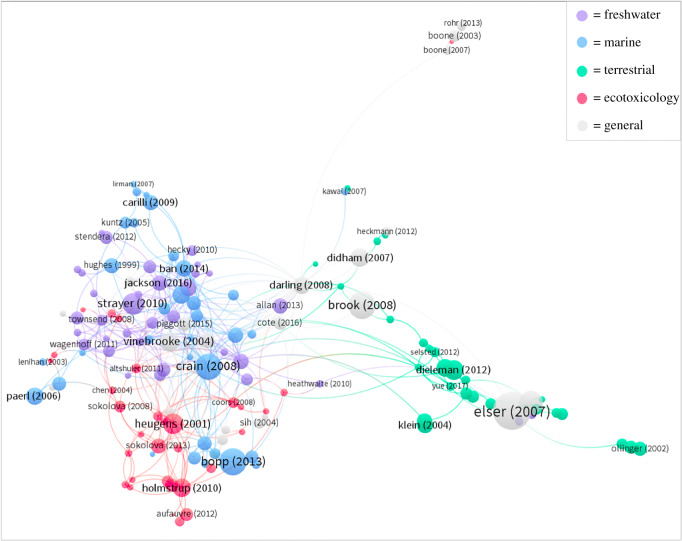
Figure 1.
Citation network where the nodes represent publications and the links indicate the presence of a citation between connected publications. The size of the nodes represents the number of citations normalized by age. The distance between nodes is calculated using a citation analysis algorithm which determines the relatedness of items based on the number of times they cite each other. The colours of the nodes and their links represent the disciplines they belong to. (Online version in colour.)

