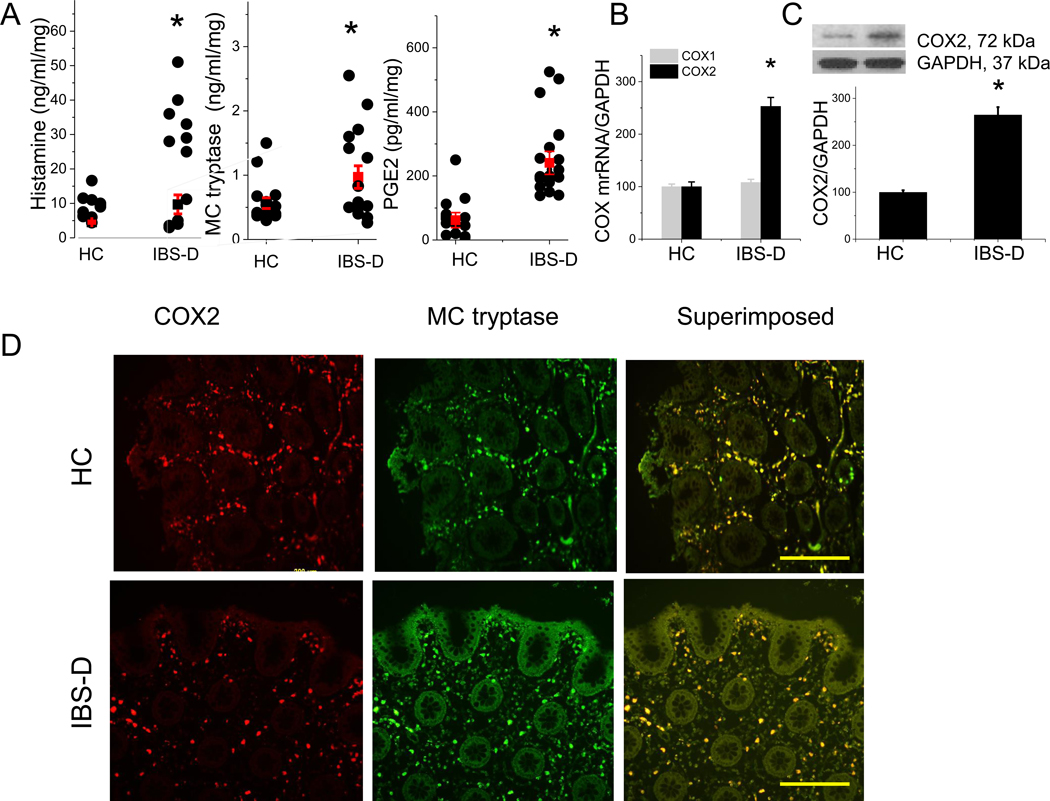
Figure 1. Proinflammatory mediators released from colonic mucosa of IBS-D patients and healthy controls (HC).
(A) Release of histamine, tryptase, and PGE2 from colonic biopsies obtained from IBS-D patients and HC. Results are expressed as mean ± SEM, n = 12–23 in each group. *P < 0.05 from HC, Student t test. (B) RT–PCR of COX1 and COX2 in colonic biopsy samples from IBS-D and HC (n = 9 in each group). Results are expressed as mean ± SEM, *P < 0.05 from HC, Student t test. (C) Western blot of COX2 from IBS-D and HC colonic biopsy samples, quantified by densitometry analysis of the blots. Results are expressed as mean ± SEM, *P < 0.05 from HC, Student t test, n = 5 in each group. (D) Immunofluorescence staining for COX2 (red) and MC tryptase (green) in colonic biopsies from HC and IBS-D patients. Superimposed images demonstrate significant overlap of COX2 and MC tryptase immunoreactivity (yellow). Scale bar, 200 μm.

