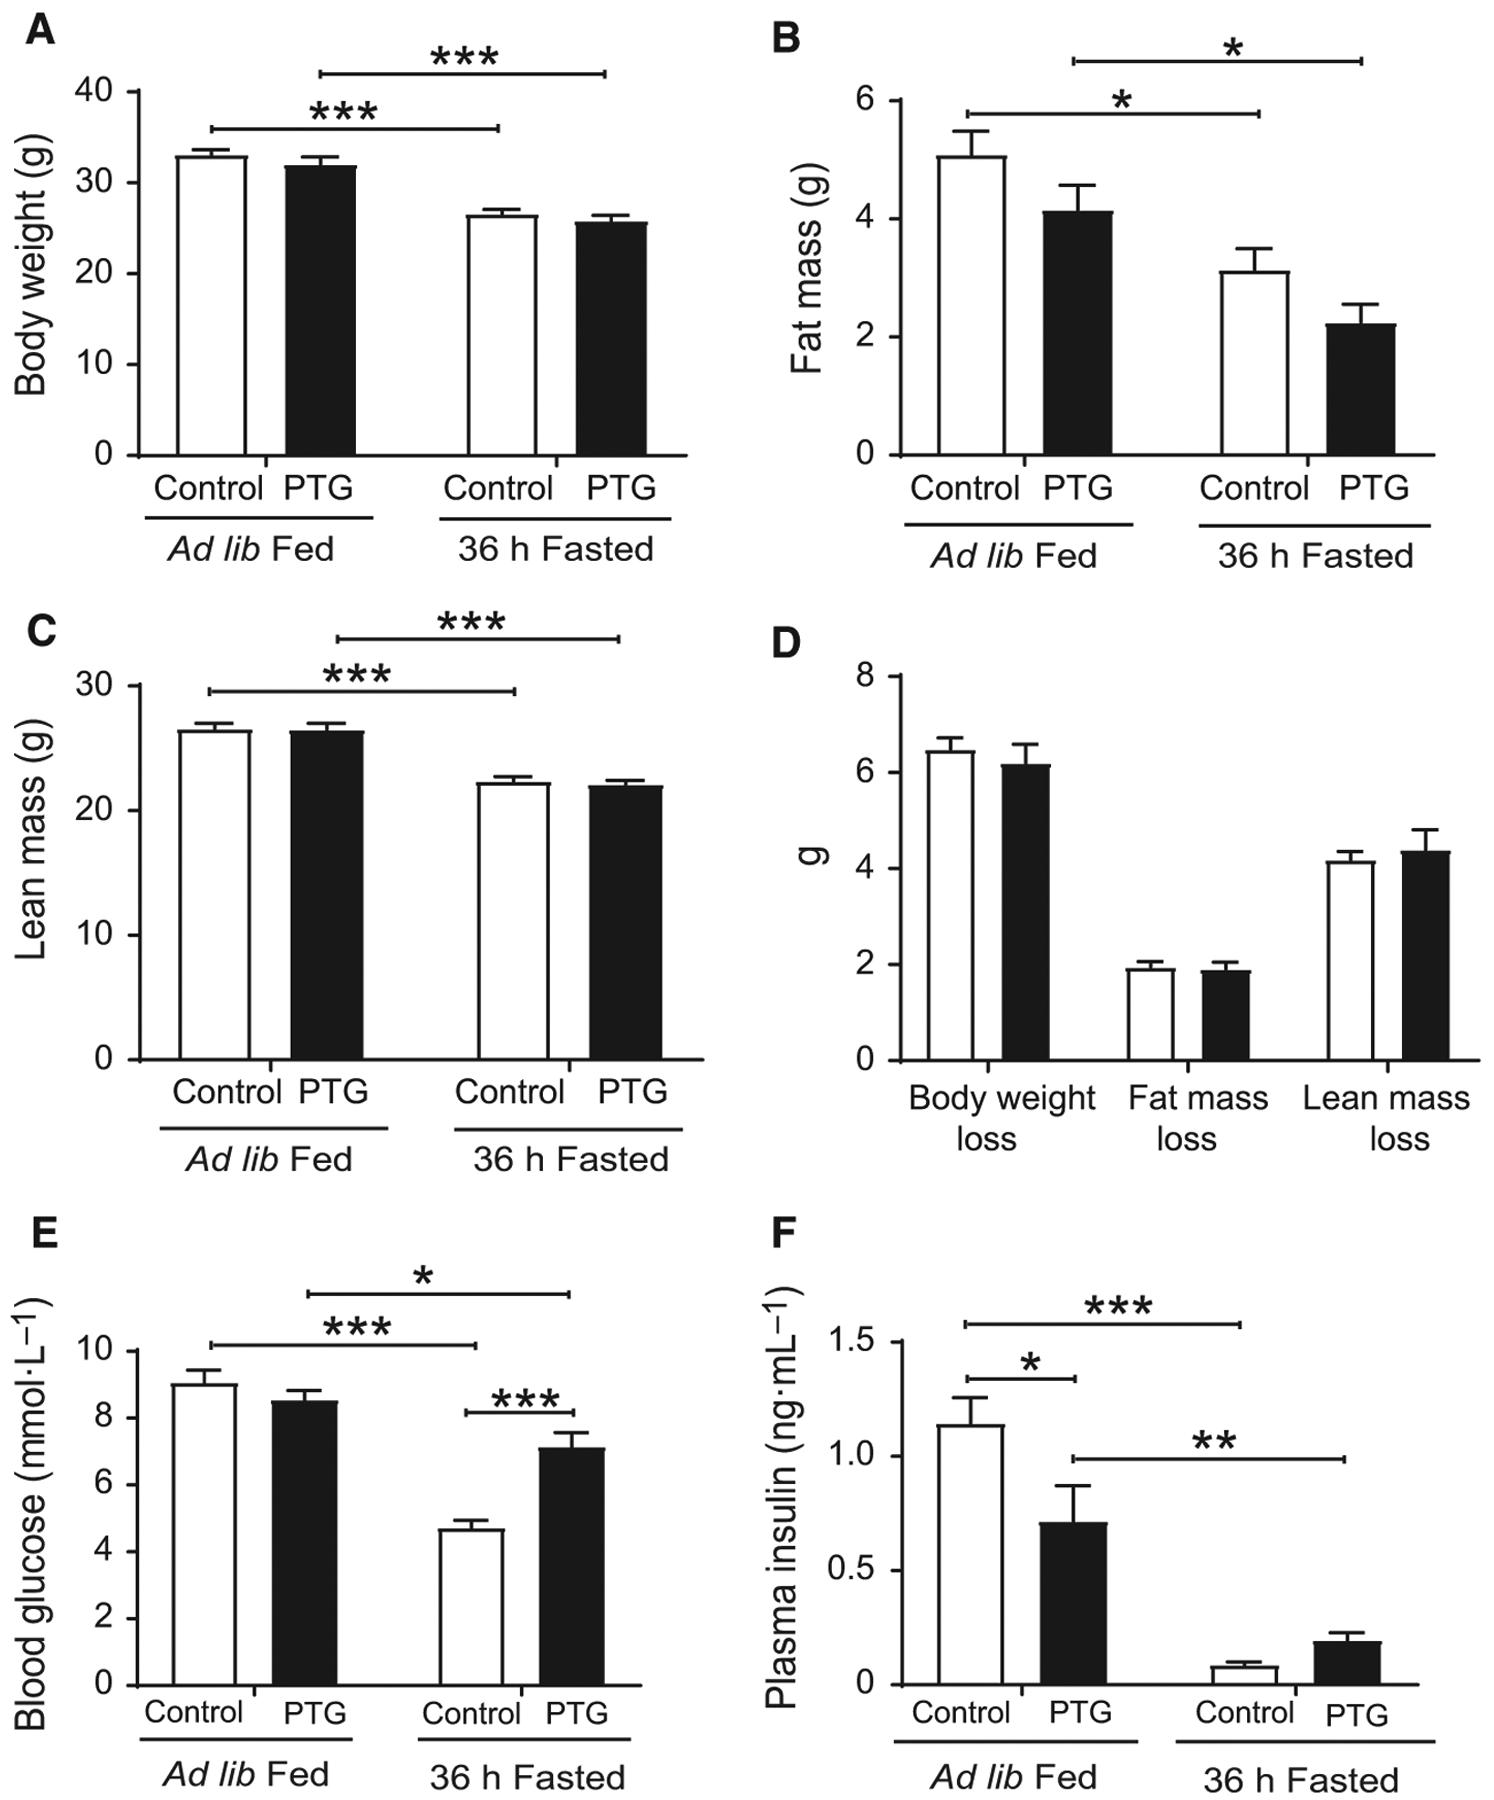
Fig. 1.

Body weight, lean, and fat mass of control (white bars) and PTGOE (black bars) mice under fed or fasted conditions. Animals were either allowed ad libitum access to food or were subjected to a 36-h fast. (A) Body weight. (B) Fat weight. (C) Lean weight. (D) Body weight loss, fat weight loss, and lean weight loss. (E) Blood glucose concentration. (F) Plasma insulin levels. Data are presented as mean ± SEM. *P < 0.05, **P < 0.01, and ***P < 0.001. n = 15 for body, fat, and lean weight, and n = 8 for glucose and insulin.
