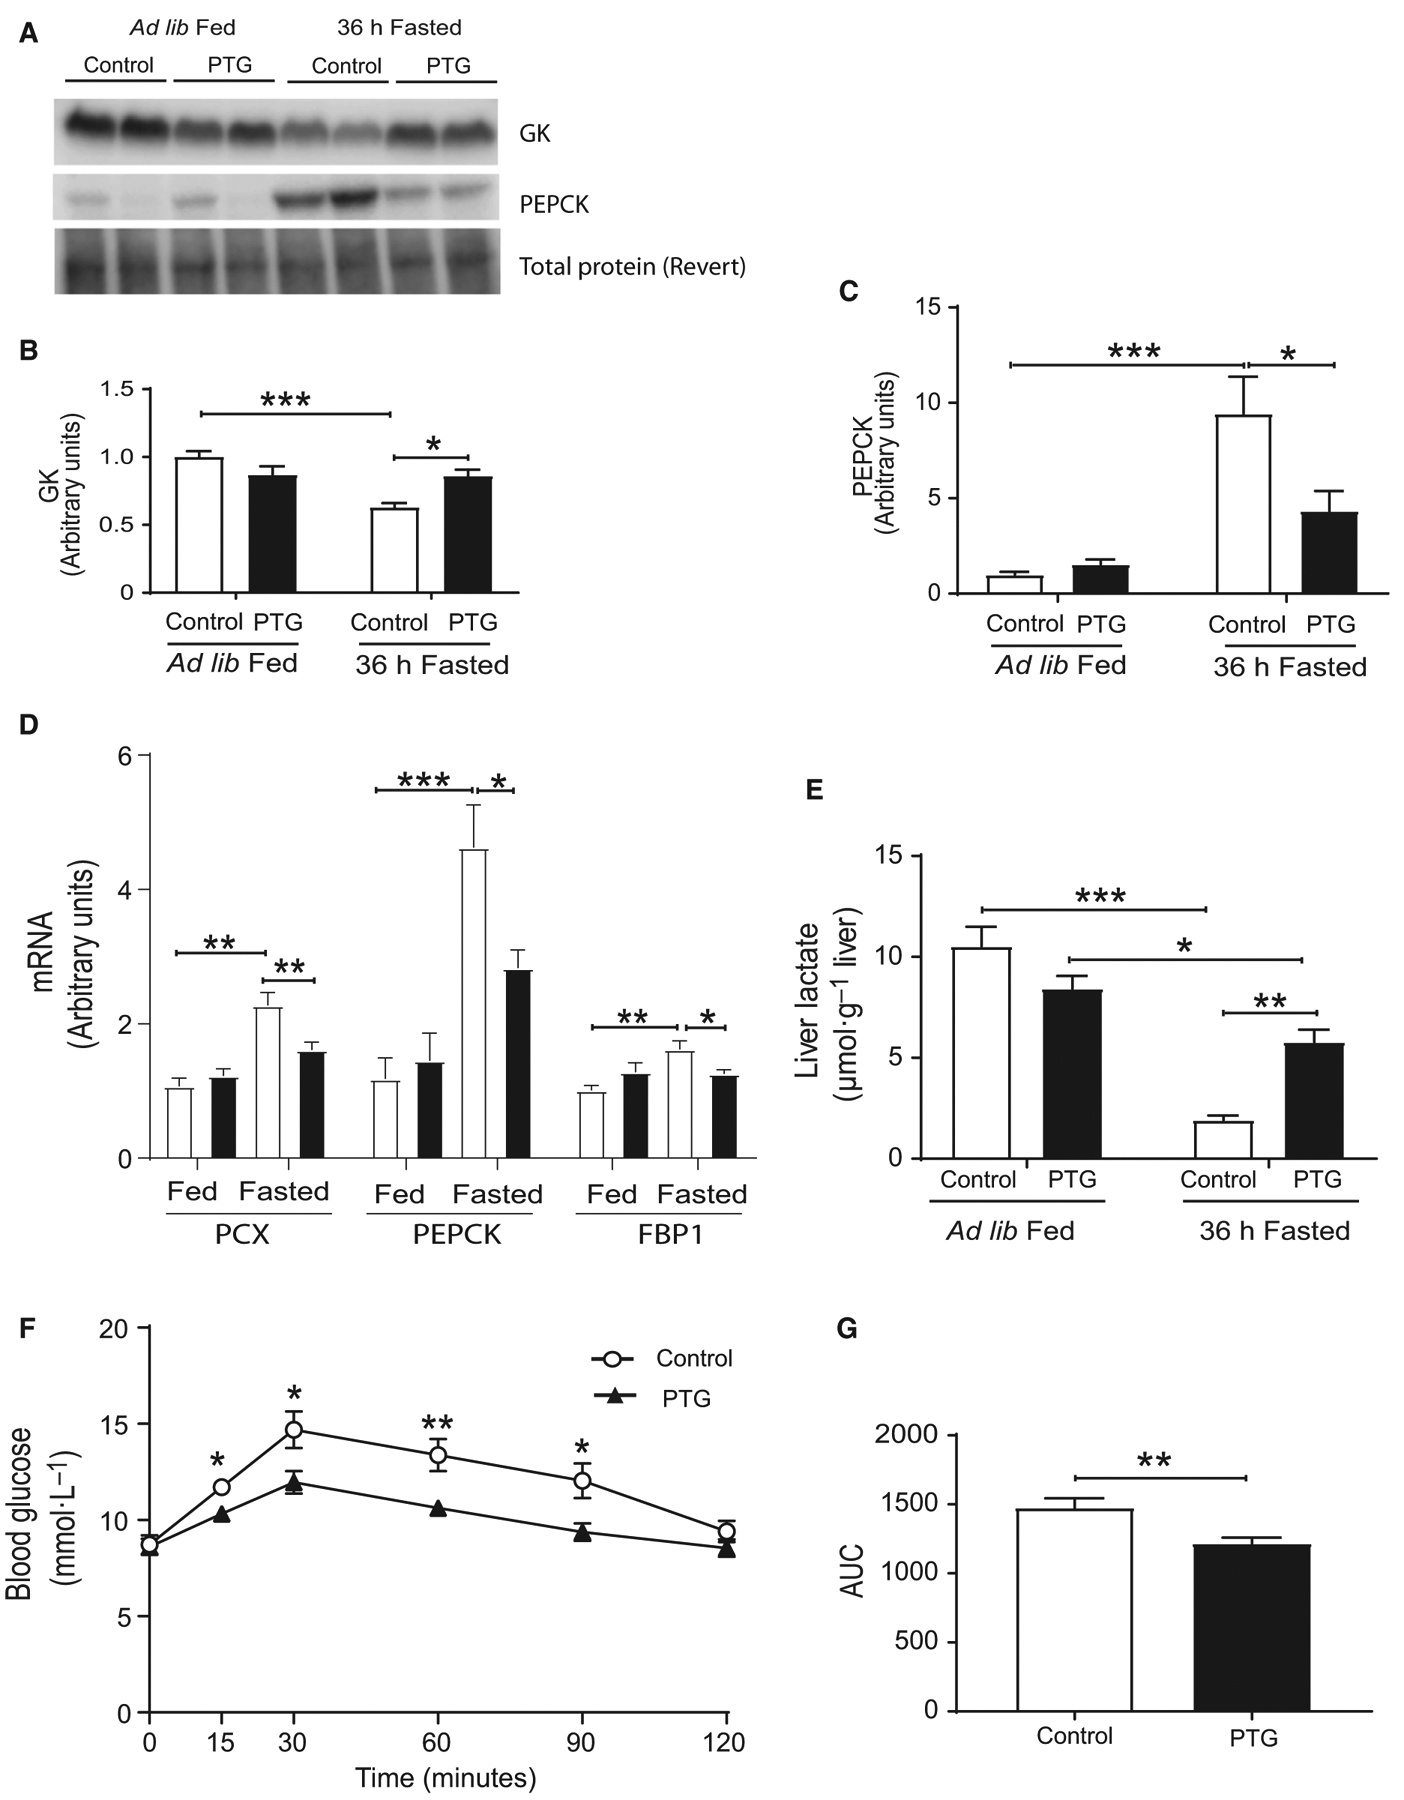
Fig. 4.

Hepatic gluconeogenesis of control (white bars) and PTGOE (black bars) mice under fed or fasted conditions. (A) Western blot of liver lysates. (B) Amount of GK measured by western blot. (C) Amount of PEPCK measured by western blot. (D) Expression of genes associated with gluconeogenesis (PCX, PEPCK, and FBP1). (E) Liver lactate content. (F) Pyruvate tolerance test after 6-h fasting. (G) AUC. AUC was calculated from blood glucose profiles during pyruvate tolerance test. Data are presented as mean ± SEM. *P < 0.05, **P < 0.01, and ***P < 0.001. n = 8 for western blot, n = 8–28 for gene expression, and n = 6–8 for pyruvate tolerance test.
