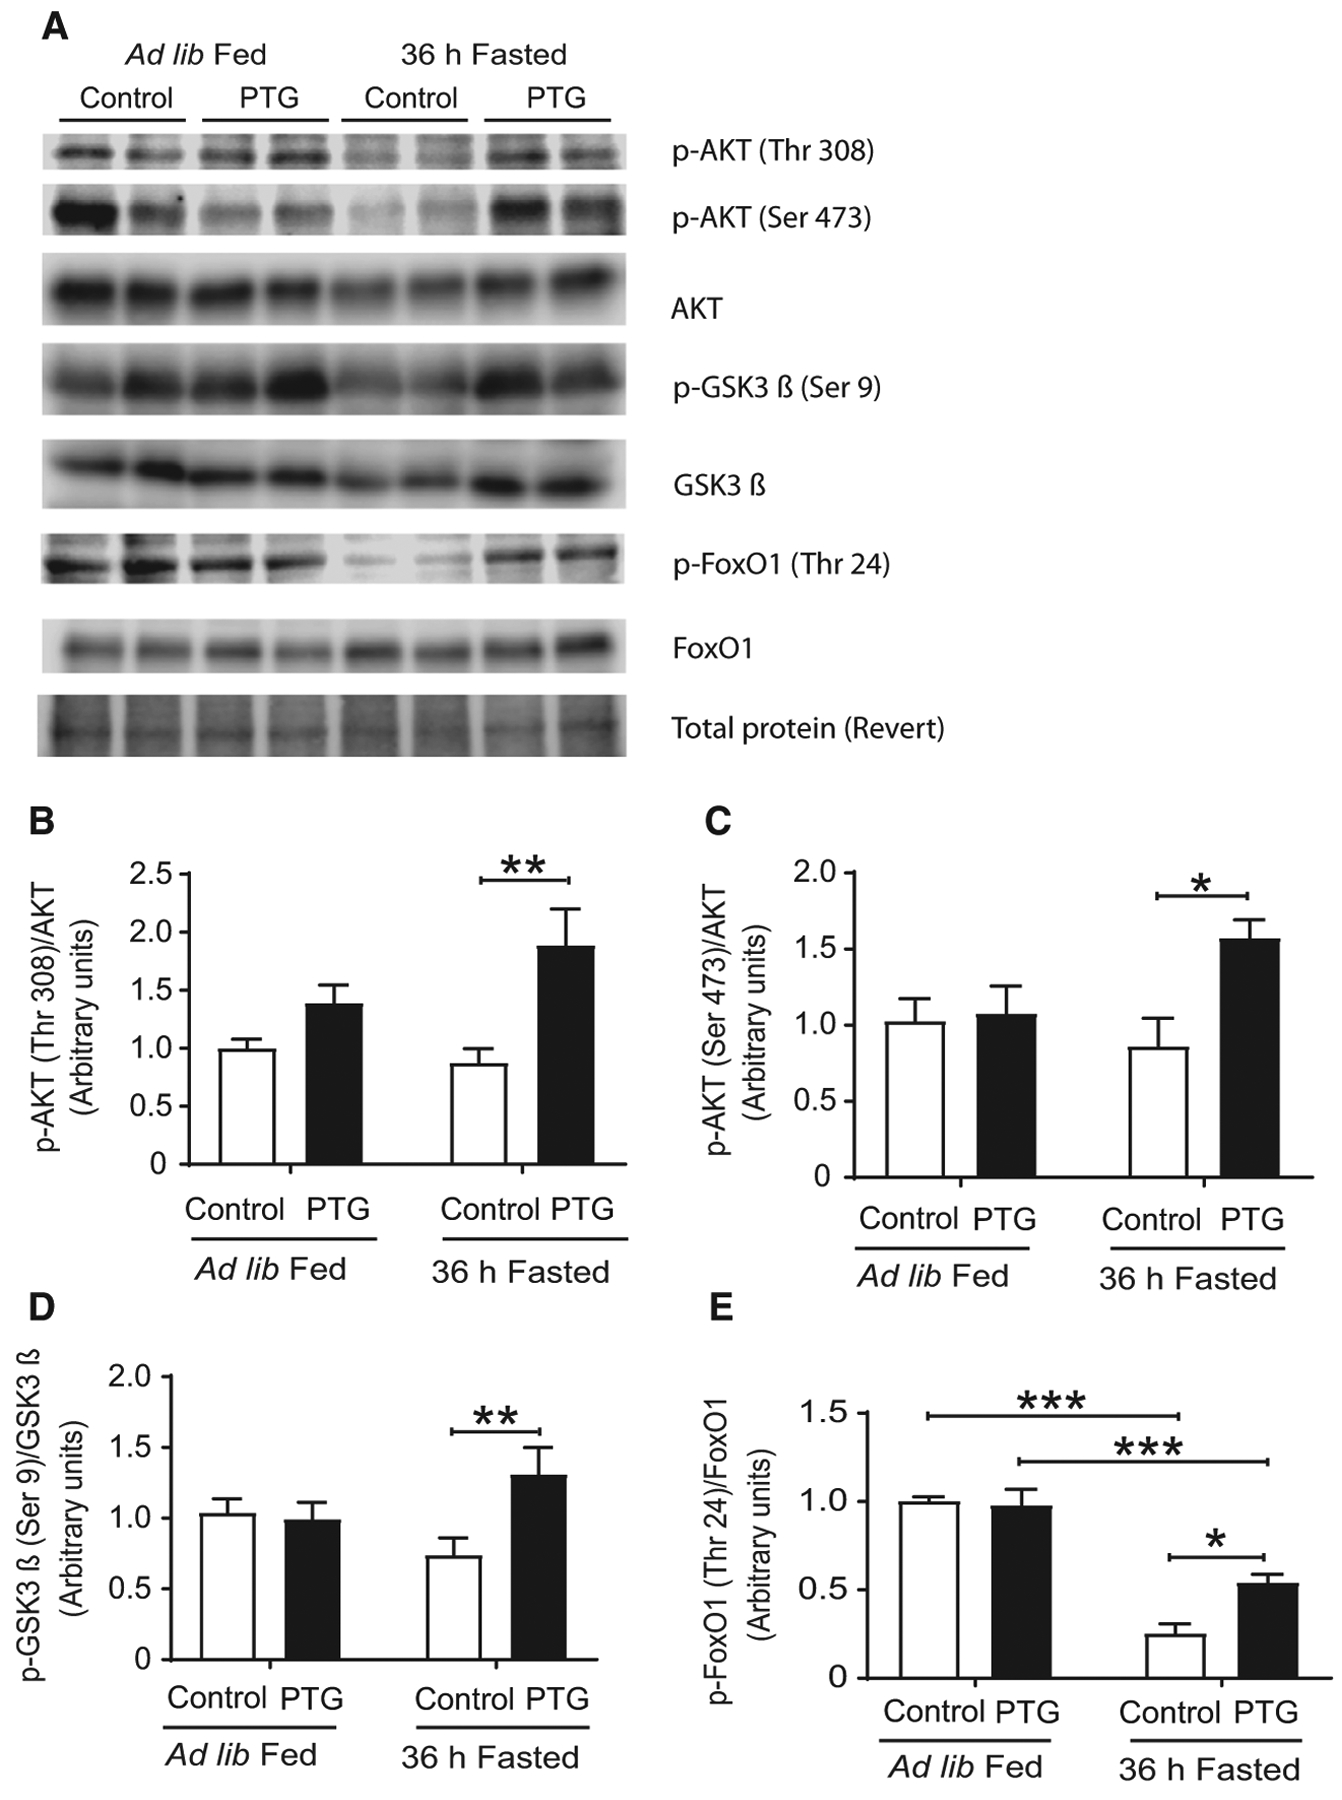
Fig. 5.

Hepatic insulin signaling of control (white bars) and PTGOE (black bars) mice under fed or fasted conditions. (A) Western blot of liver lysates. (B) Amount of total and phosphorylated AKT in threonine 308 measured by western blot. (C) Amount of total and phosphorylated AKT in serine 473 assessed by western blot. (D) Amount of total and phosphorylated GSK3β assessed by western blot. (E) Amount of total and phosphorylated FoxO1 assessed by western blot. Data are presented as mean ± SEM. *P < 0.05, **P < 0.01, and ***P < 0.001. n = 8.
