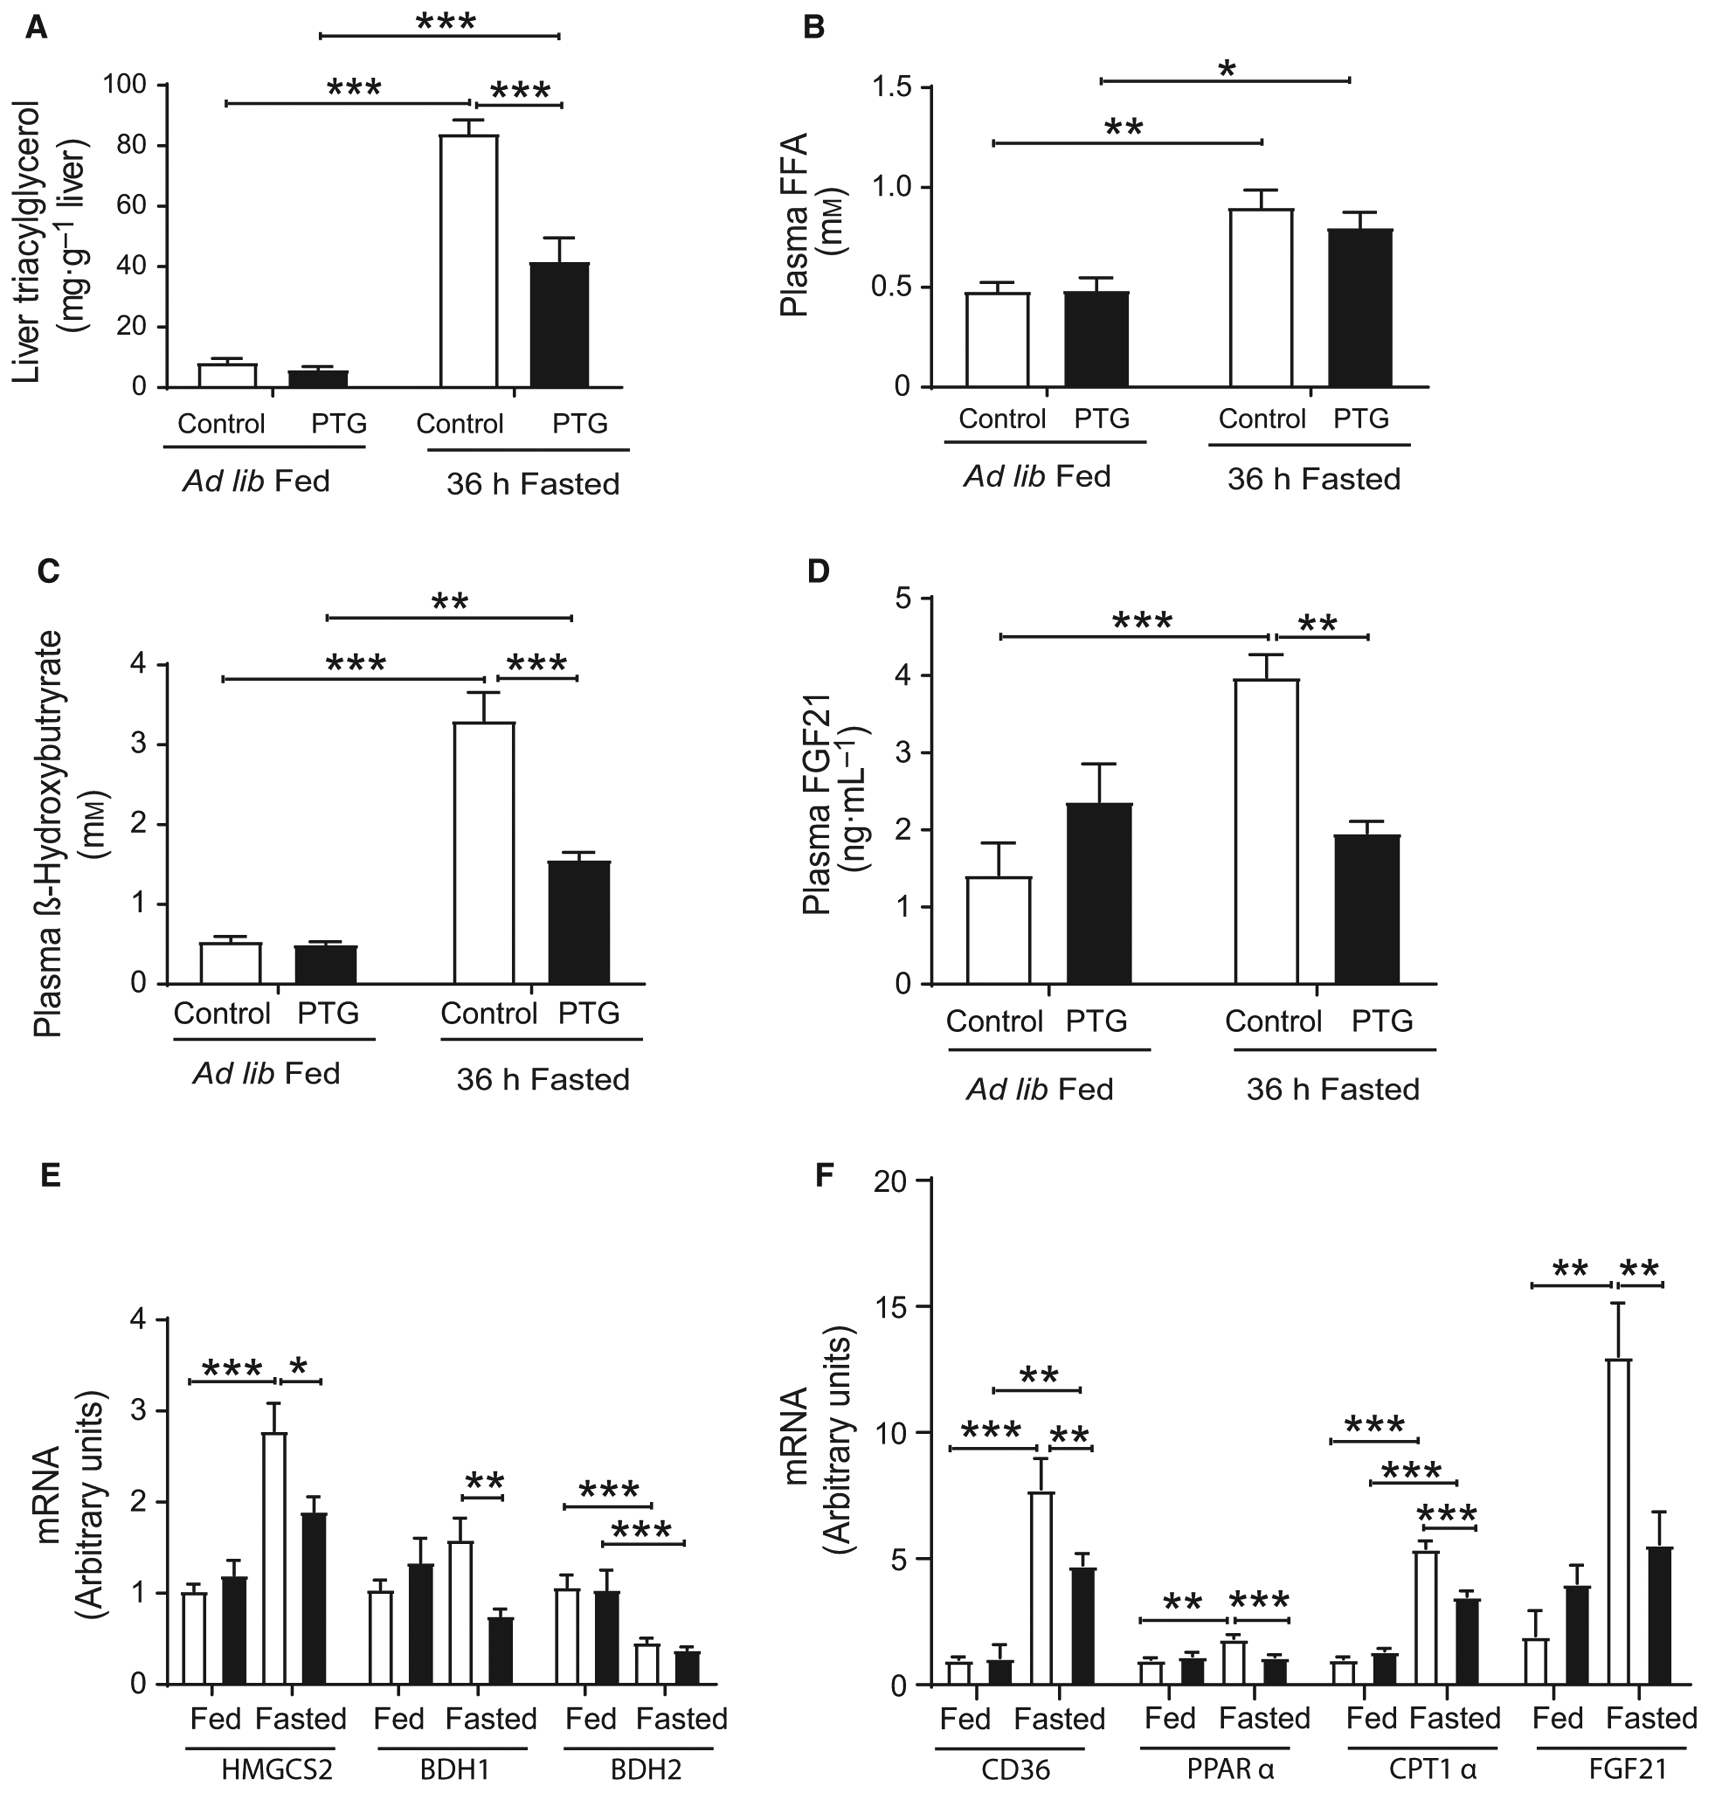
Fig. 6.

Hepatic TG, liver β-oxidation, and ketogenesis of control (white bars) and PTGOE (black bars) mice under fed or fasted conditions. (A) Hepatic TG concentration. (B) Plasma FFA levels. (C) Plasma β -hydroxybutyrate levels. (D) Plasmα FGF21 concentration. (E) Expression of genes associated with ketogenesis (HMGCS2, BDH1, and BDH2). (F) Expression of genes associated with β-oxidation (CD36, PPARα, CPT1a, and FGF21). Data are presented as mean ± SEM.*P < 0.05, **P < 0.01, and ***P < 0.001. n = 6 for hepatic TG, n = 7–8 for plasma metabolites and n = 8–28 for gene expression.
