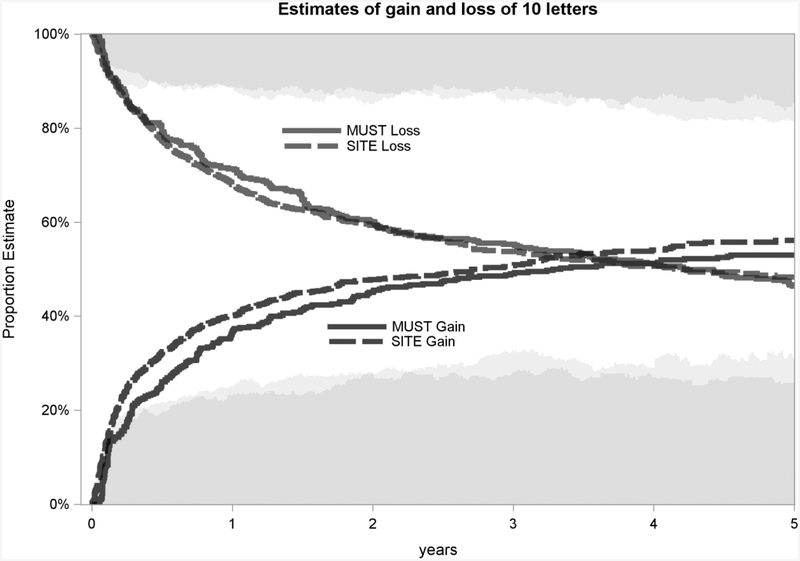
Figure 1.
Estimates of gain and loss of 10 letters
Comparison of Kaplan-Meier curves for 10 letters of gain or loss, in the observational Systemic Immunosuppressive Therapy for Eye Diseases (SITE) Cohort and in the Multicenter Uveitis Steroid Treatment (MUST) Trial and Follow-up Study Cohort. The shading at the top and bottom (light gray for SITE, dark gray for MUST) indicate the percent of remaining patients who are 10 letters below or above, respectively, their baseline visual acuity.

