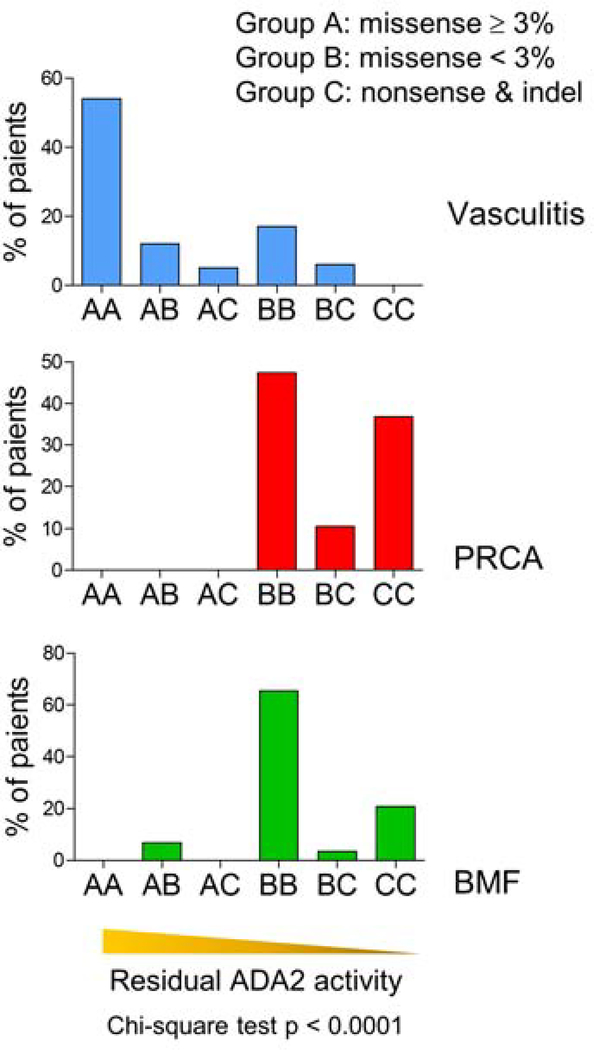
Figure 4. Genotype to phenotype analysis using patient mutation configurations.
Distribution of patients with vasculitis, PRCA or BMF phenotype in genotype categories assigned based on ADA2 mutation type and residual enzymatic activity of missense mutations (p < 0.0001, Chi-square test). Bars represent the percentage of patients of the given phenotype.

