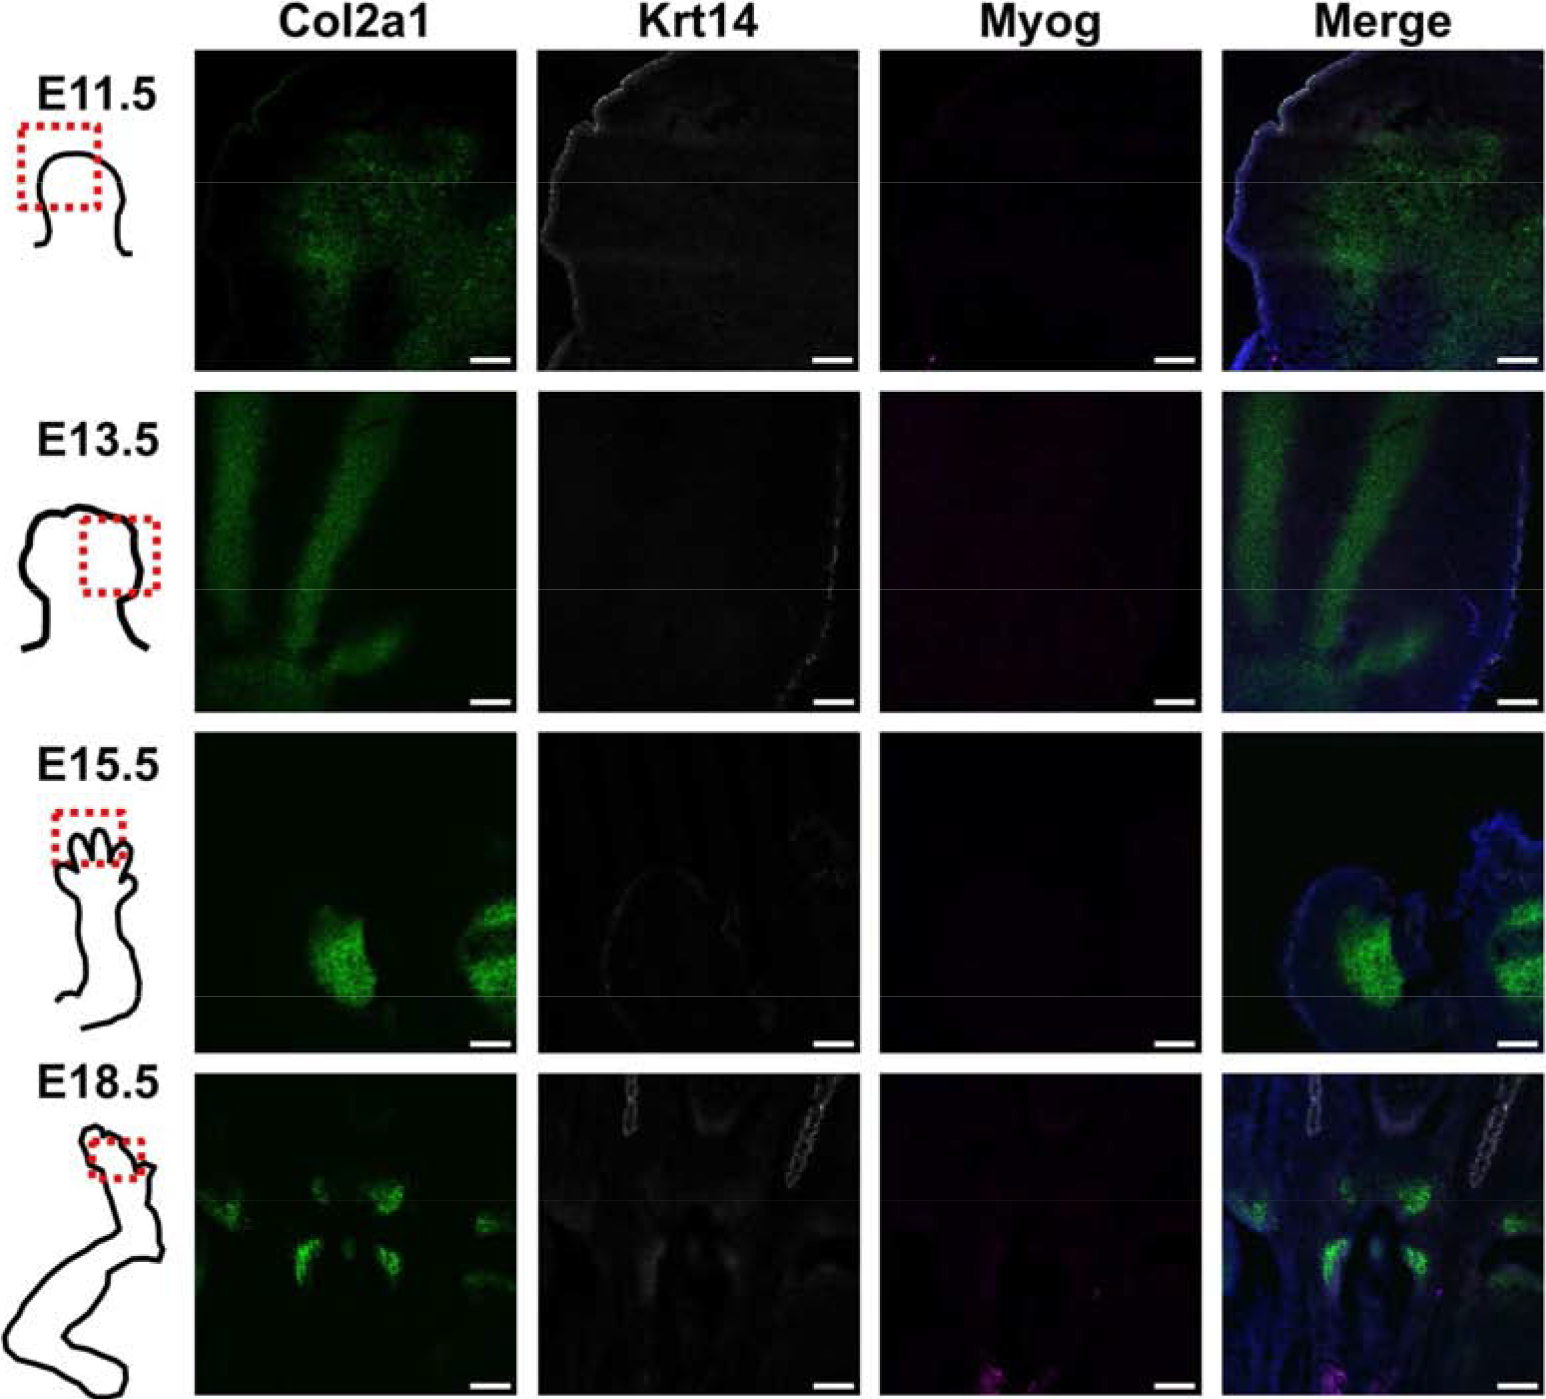
Fig. 4.

Representative RNA FISH images of hindlimbs at four developmental time points to verify spatial locations of cartilage (Col2a1), skin (Krt14), and muscle (Myog). Scale bar = 100 μm. A grayscale version of the individual channels is provided in Supplemental Fig. 4.
