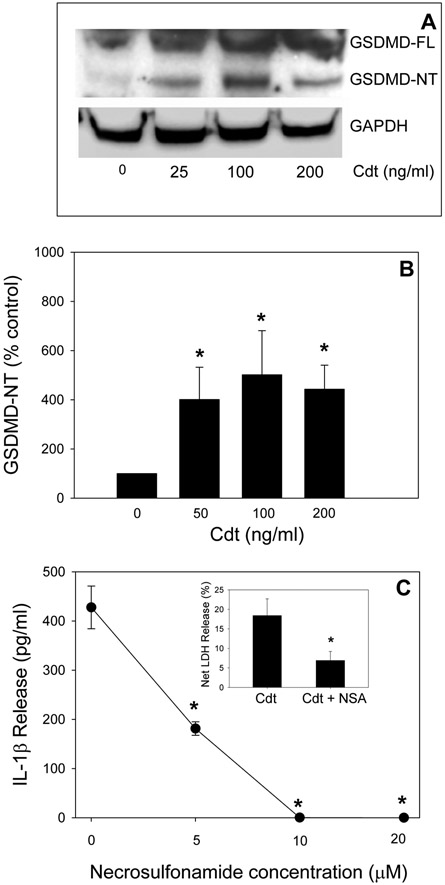
Fig. 4.
Cdt-treated macrophages exhibit GSDMD cleavage. Panel A: Macrophages derived from THP-1WT cells were incubated with varying amounts of Cdt for 24 hr. Cell extracts were analyzed by Western blot for the presence of GSDMD-NT. Panel A shows a representative blot. Panel B: shows the results of three experiments: data are plotted as percent release (relative to control cells) mean±SEM. Panel C: THP-1WT-derived macrophages were pre-incubated with varying amounts of NSA for 60 min followed by the addition of 200 ng/ml Cdt. Supernatants were analyzed 5 hrs later for the presence of IL-1β by ELISA. Results are plotted as the mean±SEM of three experiments vs NSA concentration. * indicates statistical signfiance <0.05. A representative full blot is shown in Fig. 5S.

