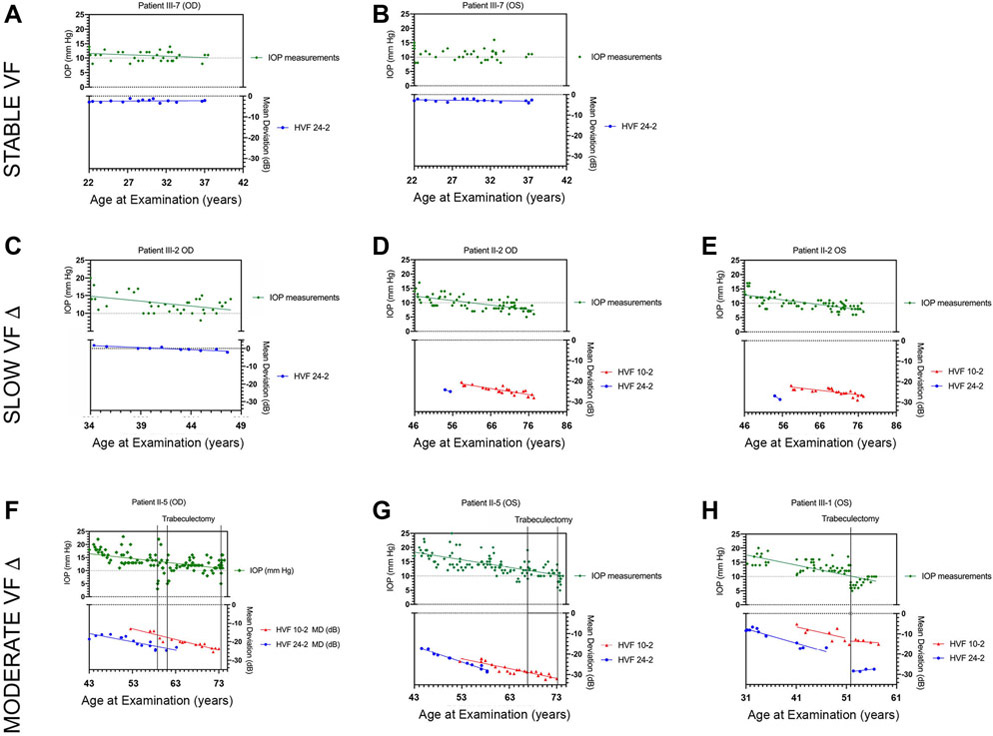
Figure 3. Longitudinal measures of IOP and Humphrey visual field tests.
Panels A-H show longitudinal plots of IOP and mean deviation (MD) from HVF tests for 8 eyes of patients with NTG caused by a TBK1 gene duplication. Linear fits Panel A and B show plots for Patient III-7 OD and OS that have stable HVF tests throughout follow-up. Panel C – E show plots for Patient III-2 OD and Patient II-2 OD and OS that have HVF tests with slow progression with a change in MD < 0.5 dB / year. Panel F – H show plots for Patient III-5 OD and OS and Patient III-1 OS that have HVF tests with moderate progression with a change in MD of 0.5 – 1.0 dB / year. The time at which a trabeculectomy surgery was performed is indicated by a vertical line in these patients.

