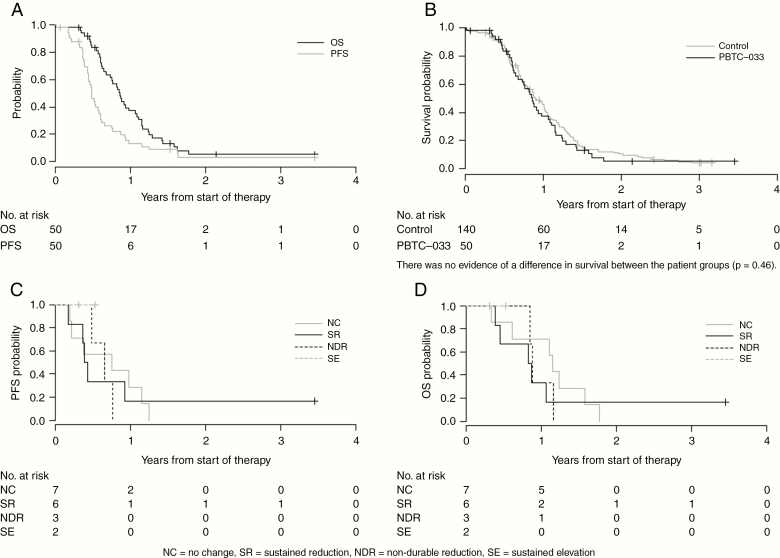
Fig. 1.
(A) OS and PFS distributions for eligible and evaluable PBTC-033 phase II patients (n = 50). (B) OS distributions for eligible and evaluable PBTC-033 phase II patients compared with PBTC historical controls. There was no evidence of a difference in survival between the patient groups (P = 0.46). (C) PFS by PAR level changes following veliparib treatment. (D) OS by PAR level changes after veliparib treatment.

