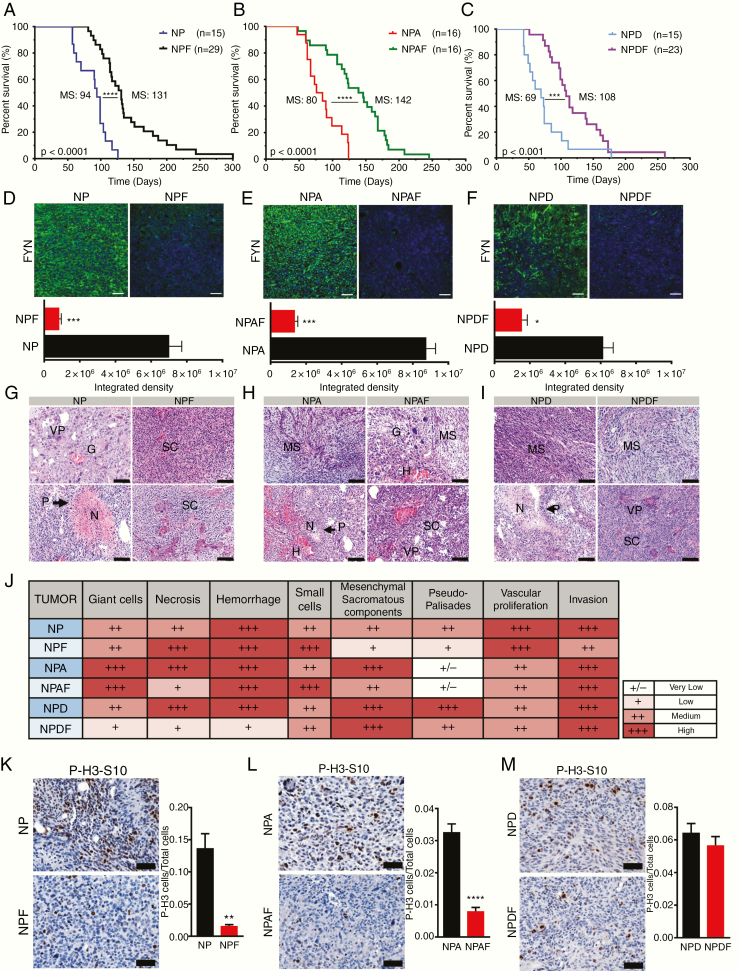
Fig. 2.
Knocking down Fyn in GEMM prolongs animal survival. (A–C) Kaplan–Meier survival curves of SB mouse glioma models demonstrate that animals bearing Fyn knockdown tumors have increased median survival. (A) NP (MS, 94 days; n = 15) versus NPF (MS, 131 days; n = 29). (B) NPA (MS, 80 days; n = 16) versus NPAF (MS, 142 days; n = 28). (C) NPD (MS, 69 days; n = 15) versus NPDF (MS, 108 days; n = 23). Log-rank (Mantel–Cox) test; ***P < 0.001, ****P < 0.0001. (D–F, top) Fyn expression in tumors (green = tumor, blue = DAPI [4′,6′-diamidino-2-phenylindole] stained nuclei), quantified as fluorescence integrated density using ImageJ software (D–F, bottom); n = 5 per condition, scale bar = 50 μm. Ten random fields per tumor section per animal were imaged. Bars ± SEM are shown (***P < 0.001, *P < 0.05 using linear mixed effect models) (G–I). Histopathological analysis was performed in tumor sections stained with hematoxylin and eosin; shFyn tumors were compared with controls. Scale bars: 100 μm. P: pseudo-palisades, N: necrosis, H: hemorrhage, VP: vascular proliferation, MS, mesenchymal component, SC: small cells, G: giant cells. (J) Table representing histopathological semi-quantitative analysis: very low (+/−), low (+), medium (++), and high (+++). (K‒M) Cell proliferation analysis: Positive P-H3-S10 cells were counted by ImageJ software. Scale bars: 50 μm. P-H3-S10 positive cells per total cells in the visual field; n = 5. Ten fields of each section were selected at random. Error bars represent ± SEM; linear mixed effect models, ***P < 0.001, **P < 0.01.

