Fig. 4.
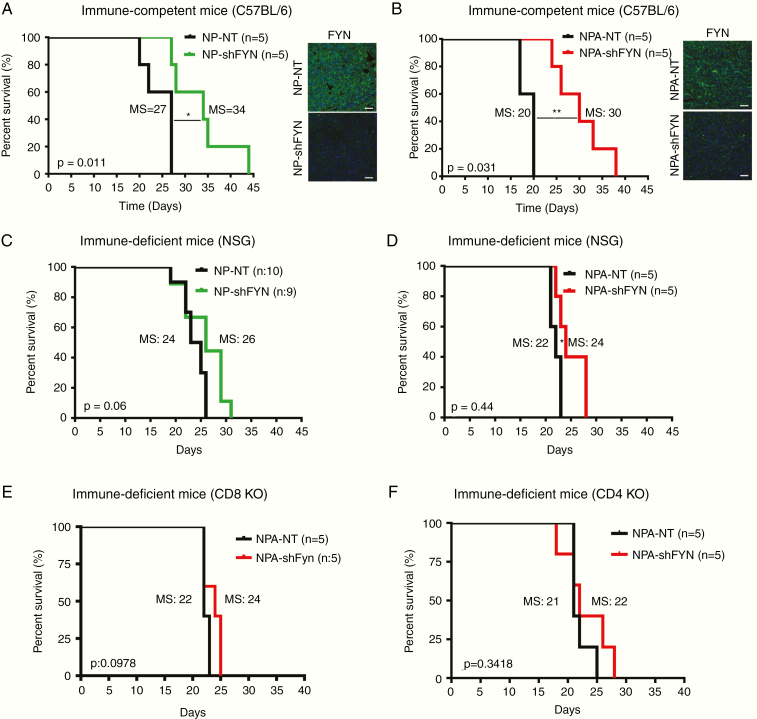
Tumor growth delay and increased survival in Fyn downregulated gliomas are immune mediated. (A, B) Kaplan–Meier survival curves for glioma in C57BL/6 immune-competent mice. (A) NP-Fyn knockdown gliomas displayed significant increases in MS: 27 vs 34 days; *P = 0.011. (B) Mice bearing gliomas with NPA-Fyn knockdown displayed significant increase in MS: 20 vs 30 days; **P = 0.0031 compared with the control; n = 5. Fyn expression was detected by immunofluorescence. Tumor: green; nuclei: blue; scale bars: 50 μm. (C, D) Kaplan–Meier survival curves in NSG immune-compromised mice. (C) NP-Fyn knockdown gliomas displayed no significant increases in MS (24 vs 26 days; P = 0.06) n = 9/10. (D) NPA-Fyn knockdown displayed a minor increase in MS (22 vs 24 days; *P = 0.044); n = 5. (E, F) Kaplan–Meier survival curve for NPA-NT vs NPA-shFyn glioma in (E) CD8 and (F) CD4 knockout immune-deficient mice. No significant difference was observed in survival. For each implantable model, n = 5 was used. Statistics were assessed using the log-rank Mantel–Cox test.

