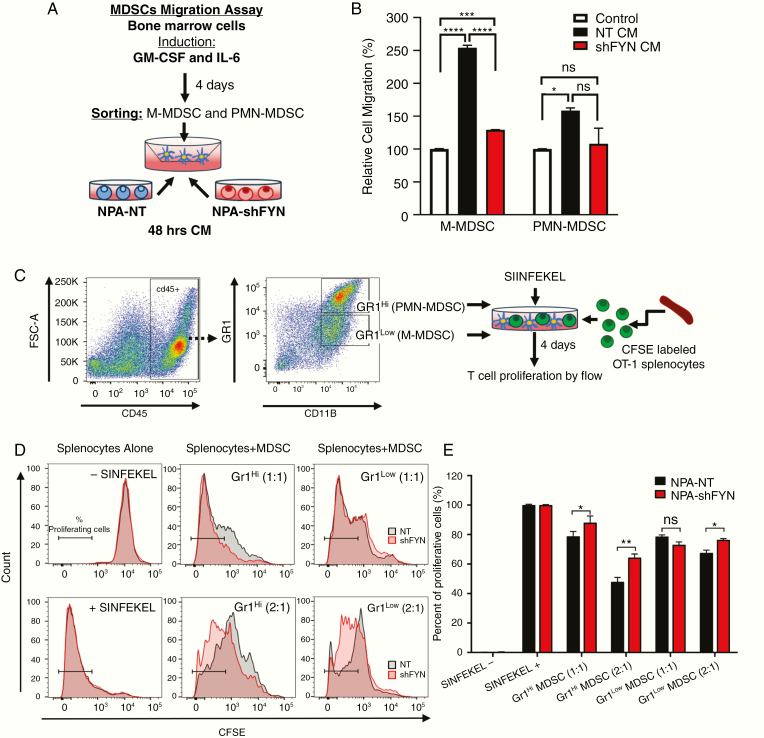
Fig. 6.
Fyn knockdown in glioma decreases MDSC migration potential and immune-suppressive activity within the TME. (A) Diagram of experimental design of MDSC Transwell migration assay. MDSCs derived from bone marrow and induced with IL-6 and granulocyte-macrophage colony-stimulating factor were seeded on the top of the Transwell and incubated for 15 hours in NT and shFyn conditioned media. The migrated cells were analyzed using CellTiter-Glo. (B) MDSC migration assay results. Data are expressed as percentage of migrating cells relative to the control (plain media). Error bars represent ± SEM. Experiment was performed 3 times with 3 replicates per treatment. Statistical significance was determined using one-way ANOVA, followed by Duncan multiple comparisons. ns: nonsignificant, *P < 0.05, ***P < 0.001, ****P < 0.0001. (C) Diagram representing the experimental design to analyze the immunosuppressive potential of MDSCs. Gr-1high (PMN-MDSC) and Gr-1low (M-MDSC) were purified from the TME of moribund NPA-NT and NPA-shFyn tumor-bearing mice. They were cultured with carboxyfluorescein succinimidyl ester (CFSE)–labeled splenocytes from Rag2/OT-1 transgenic mice. Cells were stimulated with SIINFEKL peptide and proliferation was analyzed 4 days after by flow cytometry. (D) Representative flow plots for CFSE stains from splenocytes alone SIINFEKL stimulated and nonstimulated, and the effect of SIINFEKL-induced T-cell proliferation in the presence of MDSCs from the TME. Numbers in parentheses indicate the ratio of MDSCs to splenocytes. (E) Graph shows T-cell proliferation relative to SIINFEKEL + control. Experiment was repeated 3 times. Tumors from 5 mice per group were pooled together in each experiment to obtain sufficient number MDSCs. Mean ± SEM are indicated. Data were analyzed using one-way ANOVA, followed by Duncan multiple comparisons. ns: nonsignificant, *P < 0.05, **P < 0.005.

