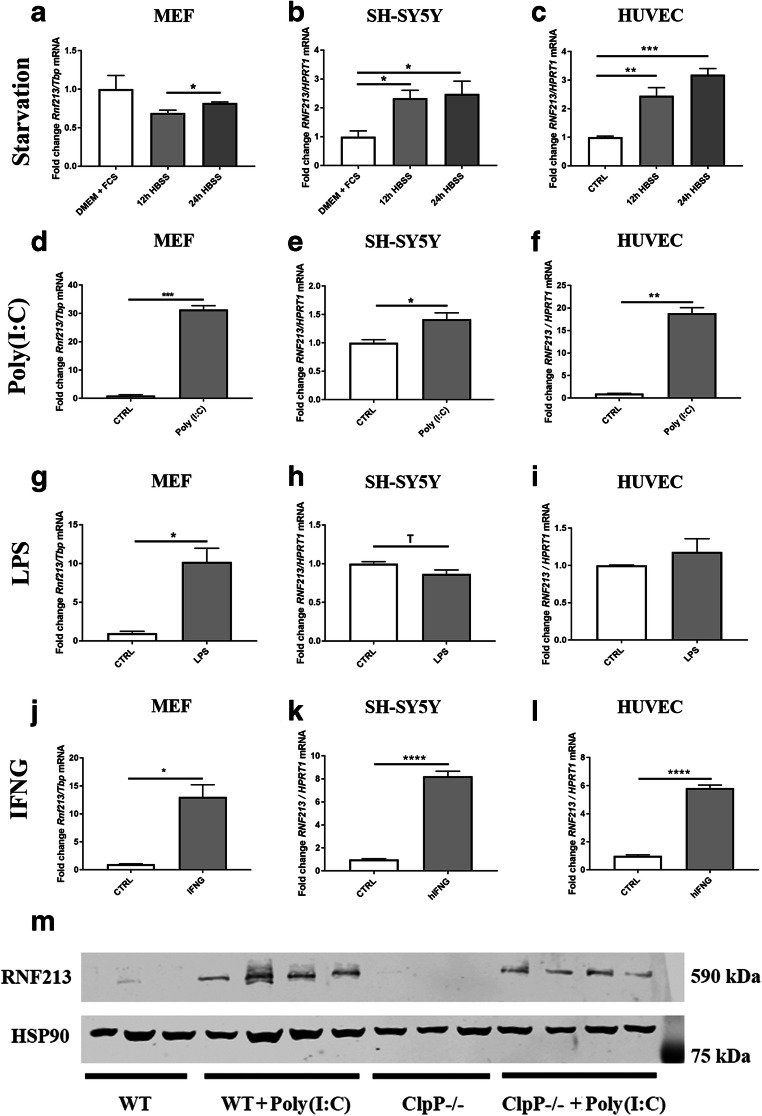
Fig. 2.
RT-qPCR analyses of wild-type MEF, human neuroblastoma SH-SY5Y cells, and human umbilical vein endothelial cells (HUVEC) for the expression of Rnf213 after exposure to different stress situations. Rnf213 transcript in a MEF, b SH-SY5Y, and c HUVEC cells after serum starvation (DMEM, Dulbecco’s modified Eagle medium; FCS, fetal calf serum; HBSS, Hank’s balanced salt solution; CTRL, untreated control) for indicated times. Rnf213 transcript in d MEF, e SH-SY5Y, and f HUVEC cells is quantified after application of the pathogenic dsRNA analog Poly(I:C) for 16. Rnf213 transcript in g MEF, h SH-SY5Y, and i HUVEC cells is quantified after incubation with the bacterial cell wall component Lipopolysaccharide (LPS) for 24 h. Rnf213 transcript in j MEF, k SH-SY5Y, and l HUVEC cells is quantified after incubation with murine or human interferon gamma (IFNG). The Y-axis of each plot shows the ratio of a transcript of interest versus mouse Tbp or human HPRT1 as loading control. The bar graphs show mean and standard error of the mean (SEM), illustrating the significances with asterisks (Trend T 0.05 < p < 0.1; *p < 0.05, **p < 0.01, *** p < 0.001, **** p < 0.0001). m Quantitative immunoblot for RNF213 protein expression in untreated WT and ClpP−/− MEF cells, and after incubation with Poly(I:C) at 1 μg/ml for 16 h. HSP90 served as loading control

