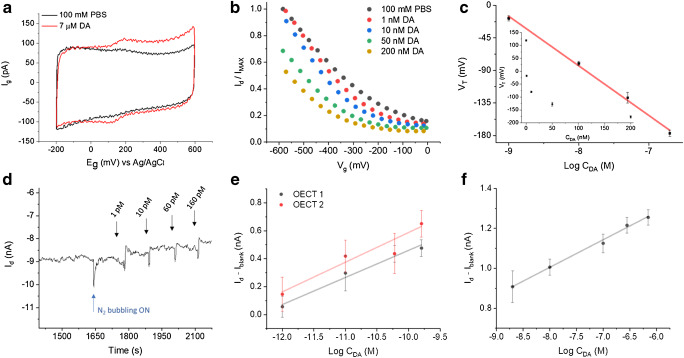
Fig. 5.
Dopamine detection with the needle-type OECT. a Electrochemical response of the PEDOT:PSS gate electrode to DA. Scan rate 100 mV s−1. b Transfer curves recorded in presence of increasing amounts of DA. Vd = − 200 mV, scan rate 10 mV s−1. c Threshold voltage response to the concentration (inset) and logarithm of DA concentration in the nM range. Standard deviations are given as error bars. dId vs time curve recorded during increasing additions of DA in the range from 1 to 160 pM (Vg = − 900 mV; Vd = − 300 mV). Calibration curves obtained e from 1 to 160 pM and f from 2 to 700 nM DA

