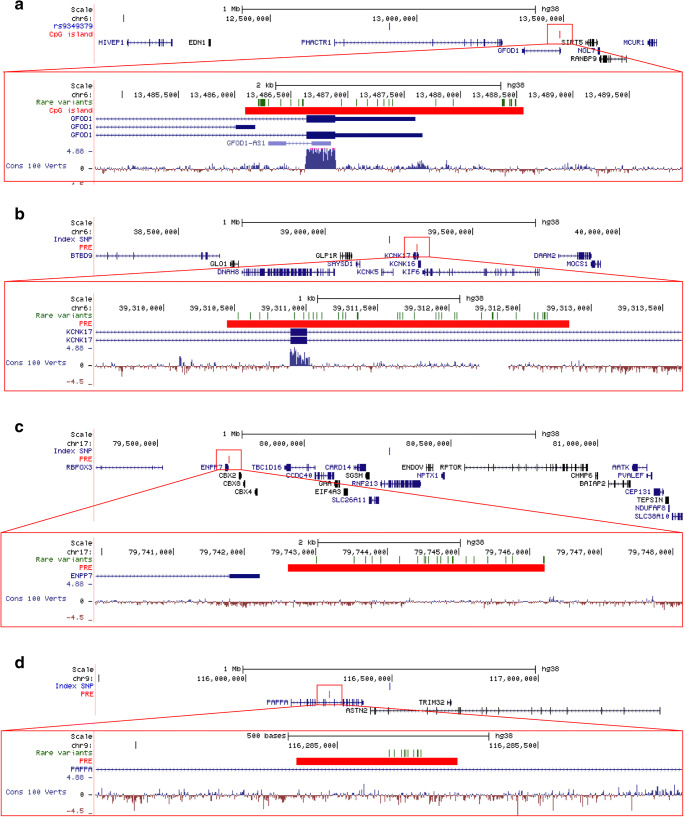
Fig. 2.
The genomic regions in which the four regulatory regions are located. In the top of each figure is 1 Mb pairs upstream and downstream of the index SNP defining the migraine risk loci displayed. Within this 2 Mb pair window, regulatory regions were annotated and rare variants within these were assessed. The index SNP defining the migraine risk loci is located in the middle, and below are the regulatory regions (the CpG island and the PREs) in which rare variants associated with an increased migraine risk and genic transcript information. In the bottom of each figure is a close-up of the regulatory regions. Here, the rare variants, that had an increased burden in the familial association analysis, are indicated. The genomic regions surrounding a the PHACTR1 locus and the CpG island, b the KCNK5 locus and the PRE, c the RNF213 locus and the PRE, and d the ASTN2 locus and the PRE

