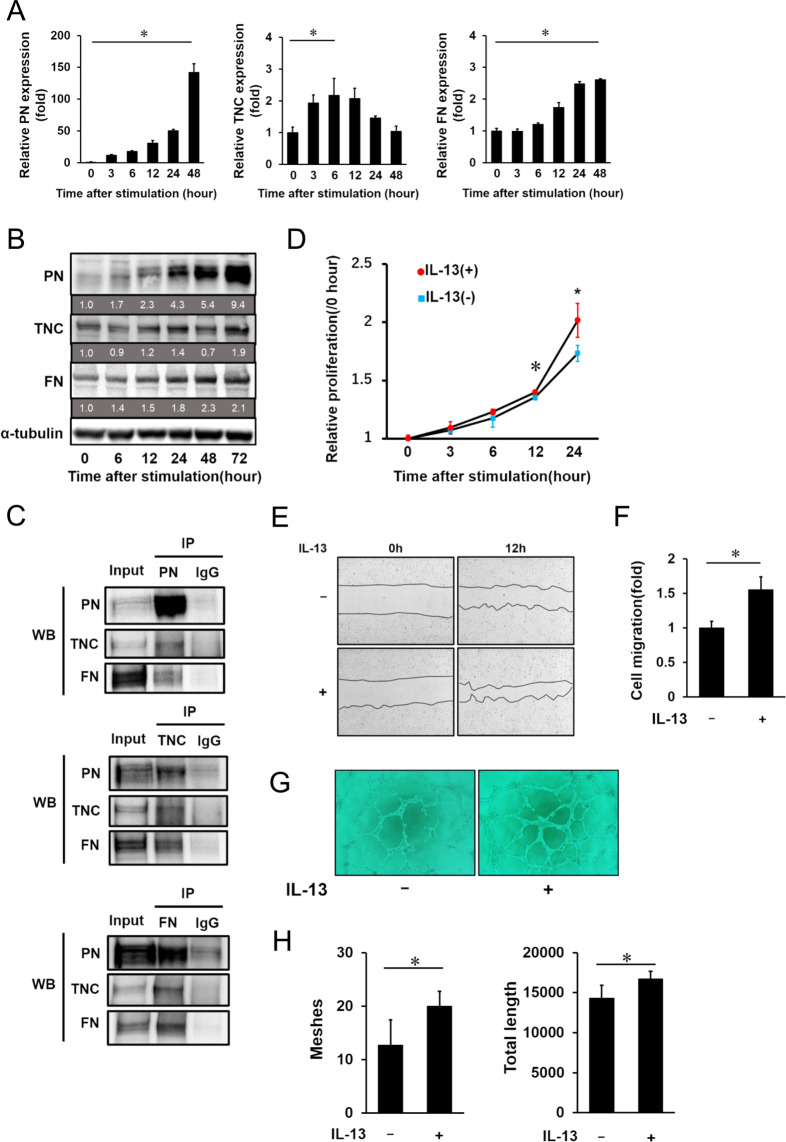
Figure 2.
IL-13 induces PN, TNC and FN expressions and promotes proliferation, migration and tube formation of HRECs. Expression of PN, TNC and FN mRNA (A) and protein (B) in HRECs stimulated by IL-13 (10 ng/ml). (A) PN, TNC and FN mRNA expression after IL-13 stimulation at different time points determined by qRT-PCR. All mRNA levels were normalized to GAPDH mRNA expression. Relative mRNA levels at 3, 6, 12, 24 and 48 h after IL-13 stimulation are shown as fold changes. Error bars represent standard deviations. *p < 0.05, Wilcoxon rank sum test, n = 4/group. (B) Western blot analysis of PN, TNC and FN in the cell lysates of HRECs after stimulation by IL-13 at different time points. α-tubulin was used as a reference protein. Protein expression levels relative to 0 h were labeled under each corresponding band. (C) Co-immunoprecipitation of cell lysates from HRECs stimulated by IL-13. The cell lysates were immunoprecipitated with IgG, anti-PN antibodies, anti-TNC antibodies and anti-FN antibodies. The precipitates were analyzed by western blotting with anti-PN, anti-TNC and anti-FN antibodies. Full-length gel images of Fig. 2B,C are displayed in Supplementary Figure S1, and graph images showing quantification of signal intensity of the bands are placed in Supplementary Figure S2. Role of IL-13 in cell proliferation (D), cell migration (E,F) and tube formation (G,H) of HRECs. (D) Relative proliferation rate of HRECs treated with IL-13 is shown as growth curves. Error bars represent standard deviations. ⋆p < 0.01, *p < 0.05, Wilcoxon rank sum test, n = 6/group. (E) Representative images of scratch wound healing assay in HRECs treated with or without IL-13. The left images show scratched areas before IL-13 stimulation and the right images show the same areas at 12 h post stimulation. (F) Cell migration was assayed by calculating areas compensated by migrated HRECs. The data of HRECs with IL-13 stimulation group is shown as fold changes. Error bars represent standard deviations. *p < 0.05, Wilcoxon rank sum test, n = 4/group. (G) Representative images showing HRECs tube formation with or without IL-13 stimulation. (H) The graphs show the quantification of meshes and total length of HRECs with IL-13 treatment in the tube formation assay. Error bars represent standard deviations. *p < 0.05, Wilcoxon rank sum test, n = 6/group.

