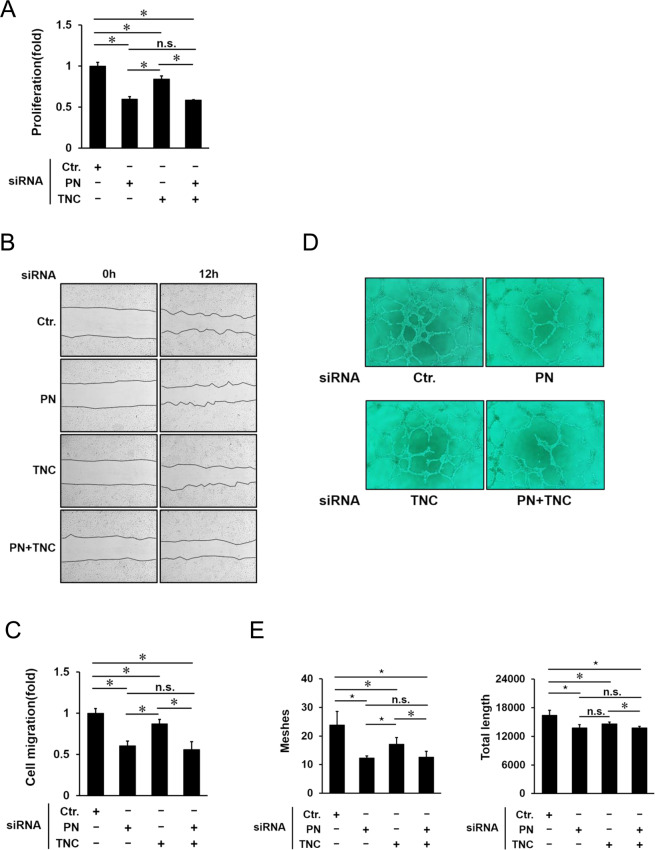
Figure 4.
Inhibition of PN and/or TNC suppresses angiogenic functions; cell proliferation, cell migration and tube formation. (A) Cell proliferation was assessed by CCK-8 assay. Effects of PN, TNC and their dual inhibition by siRNA on the cells treated with IL-13 for 24 h. Proliferation rates of HRECs are shown as fold changes. Error bars represent standard deviations. *p < 0.05, Wilcoxon rank sum test, n = 6/group. (B) Cell migration was assessed by scratch wound healing assay. Representative images of HRECs treated with PN, TNC and their dual inhibition by siRNA. The left images show the scratched cells at 0 h (Left) and 12 h (Right) after IL-13 stimulation. (C) Effects of PN, TNC and their dual inhibition by siRNA on cell migration were quantified by measuring the areas of migrated cells at 12 h after IL-13 treatment. The data are shown as fold changes. Error bars represent standard deviations. *p < 0.05, Wilcoxon rank sum test, n = 4/group. (D) Representative images of HRECs treated with PN, TNC and their dual inhibition by siRNA in Matrigel tube formation assay. (E) Data show the quantification of the total numbers of meshes and total length. Error bars represent standard deviations. ⋆p < 0.01, *p < 0.05, Wilcoxon rank sum test, n = 6/group.

