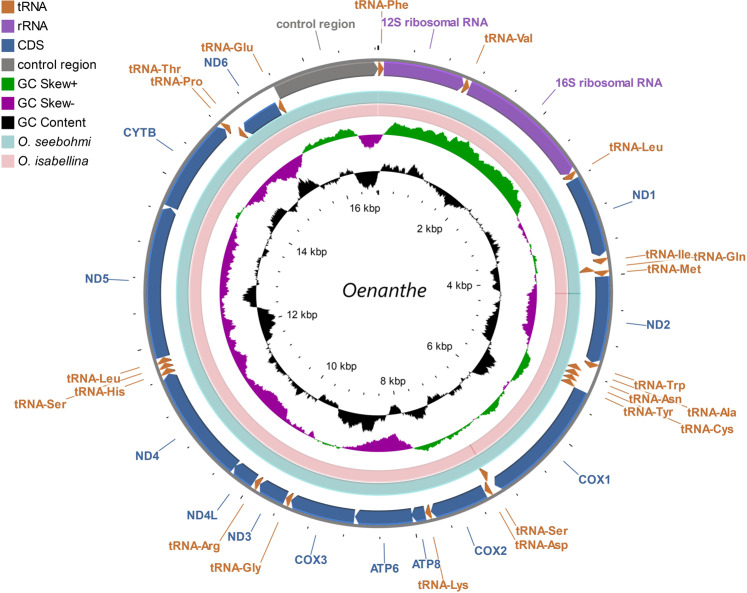
Figure 1.
Circular map of the mitogenome of Oenanthe oenanthe assembled from NGS data. Features are represented by different color blocks. Arrows indicate the orientation of the gene transcription. The GC content and GC skew were calculated using a sliding window and plotted as the deviation from the average value of the entire sequence. The BLAST comparisons of Oenanthe oenanthe with Oenanthe seebohmi and Oenanthe oenanthe with Oenanthe isabellina are shown in divider rings.

