Figure 2.
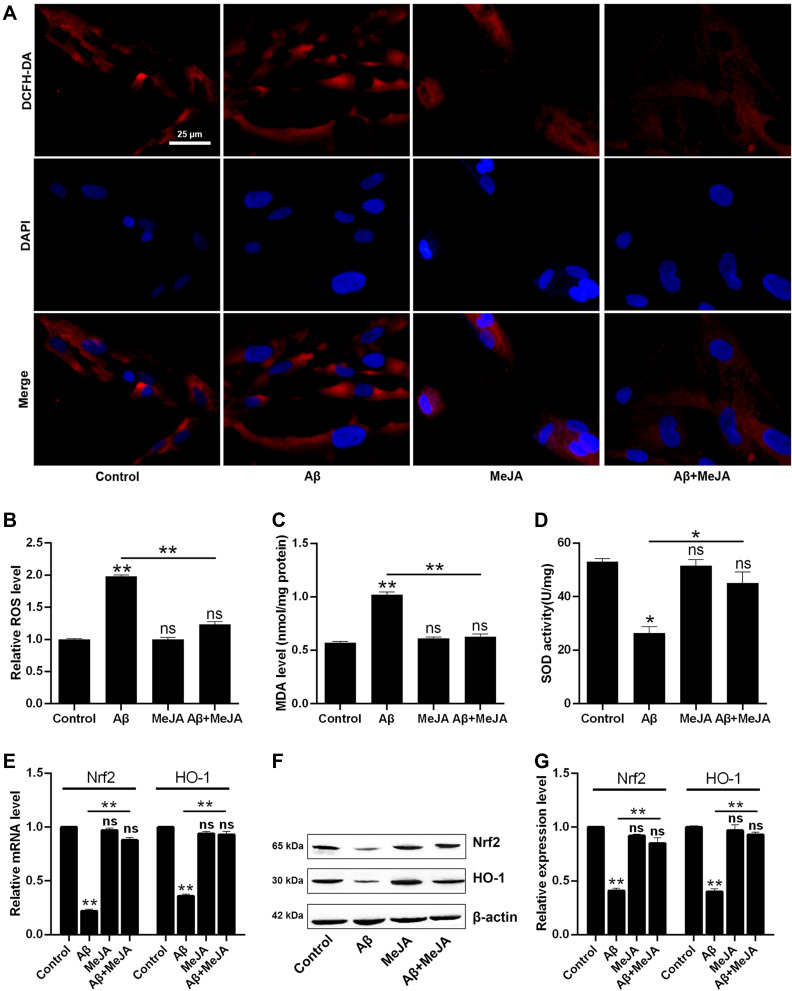
Relative production and activity of intracellular oxidation index in BV-2 cells under different treatments. The comparison of immunofluorescence images with the scale bar of 25 µm (A) and relative fluorescence intensity (B) of ROS measurement. The MDA relative level (C) and SOD activity (D) were measured by fluorescence spectrophotometry. qRT-PCR (E) and Western blot (F and G) were applied to analyze the mRNA and protein expressions of Nrf2 and HO-1. *p< 0.05; **p< 0.01.
Abbreviation: ns, no significant difference.

