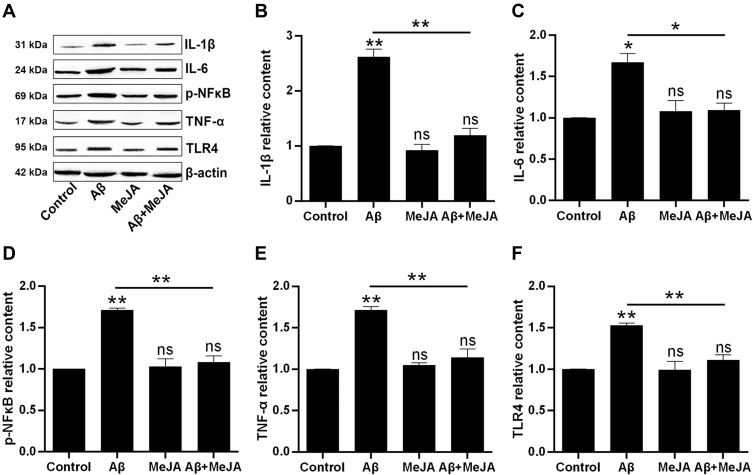
Figure 3.
The production of inflammatory cytokines in BV-2 cells under different treatments. The expressions were evaluated by Western blot (A) and the relative contents of the IL-1β (B), IL-6 (C), p-NF-κB (D), TNF-α (E) and TLR4 (F) were organized into histograms. *p<0.05; **p<0.01.
Abbreviation: ns, no significant difference.

