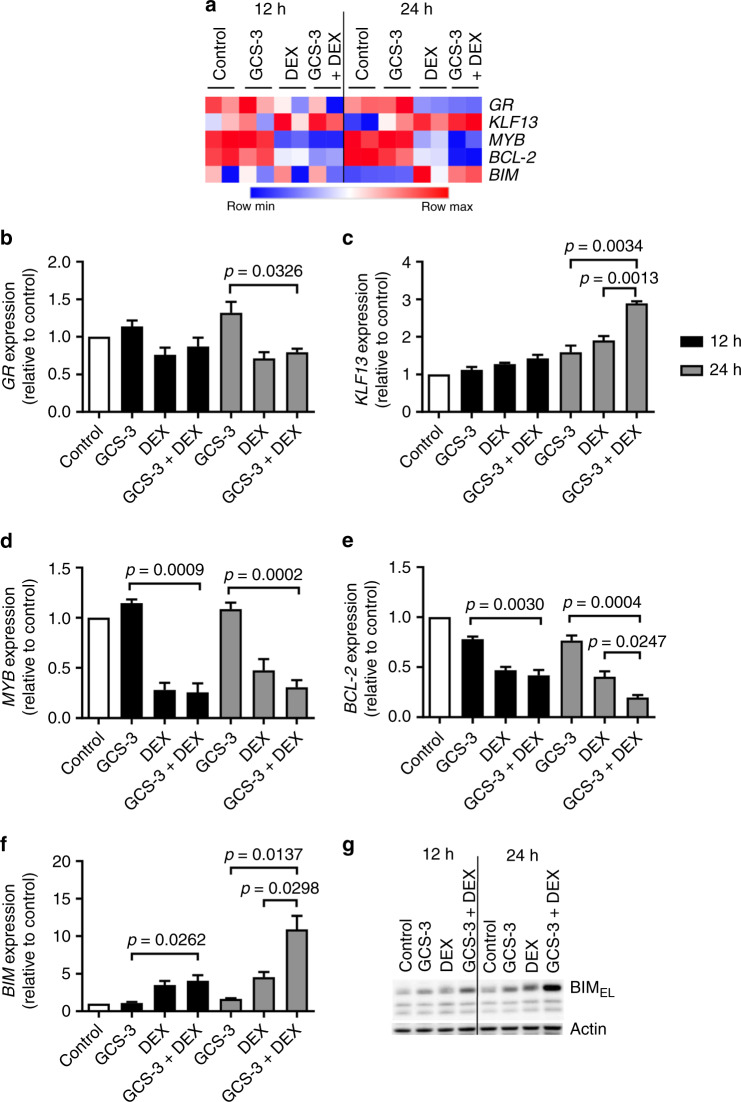
Fig. 5. Expression levels of candidate genes in ALL-19 cells.
a Microarray analysis of the effects of 10 µM GCS-3, 10 µM dexamethasone and the combination on gene expression in ALL-19 cells. Two biological replicates were analysed at 12 and 24 h post treatment, where red represents high and blue low gene expression. GR (b), KLF13 (c), MYB (d), BCL-2 (e) and BIM (f) mRNA expression was analysed by qRT-PCR and calculated relative to the 12 and 24 h vehicle-treated controls. Each data point represents the mean ± SEM of four independent experiments. Significance was calculated using the unpaired t test with Welch’s correction. g BIM protein expression was analysed after 12 and 24 h treatment by immunoblotting and a representative blot is shown.

