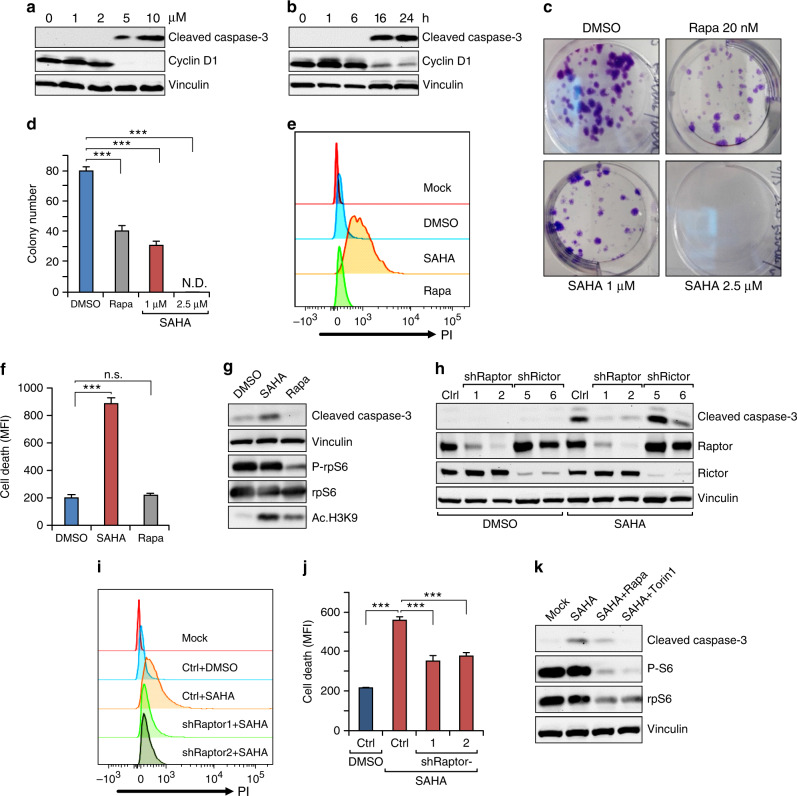
Fig. 1. HDAC inhibitors treatment induces Tsc1iΔEC tumour cells death.
a, b Western blot analysis of cleaved caspase-3 and cyclin D1 in Tsc1iΔEC tumour cells treated with SAHA at the indicated concentrations for 24 h (a) or at 5 μM for the indicated times (b). c, d Colony formation assay of Tsc1iΔEC tumour cells treated as indicated for 7 days. Representative images (c) and mean ± SD of the colony numbers (d) are shown. e, f Cell death analysis of Tsc1iΔEC tumour cells treated with SAHA (5 μM), rapamycin (100 nM) or DMSO for 18 h. Cells were stained with PI and analysed by flow cytometry, with representative results (e) and mean ± SD of MFI (f) shown. g Western blot analysis of cleaved caspase-3 and phospho-rpS6, as well as acetyl-histone H3 at lysine 9 (Ac-H3K9) upon SAHA (5 μM), rapamycin (100 nM), or DMSO treatment for 24 h. h Western blot analysis of Cl. Casp3 in Tsc1iΔEC tumour cells with raptor or rictor shRNA knockdown and non-targeting shRNA (shNT) as control (Ctrl). i, j Cell death analysis of Tsc1iΔEC Ctrl (shNT) and raptor knockdown (shRaptor) tumour cells upon SAHA (5 μM) or DMSO treatment. Cells were stained with PI and analysed by flow cytometry, with representative results (i) and mean ± SD of MFI (j) shown. k Western blot analysis of Cl. Casp3 and P-rpS6 upon DMSO, SAHA treatment or combination treatment with rapamycin or Torin1. In all western blots, vinculin is used as an endogenous loading control. For all figures, n = 3. ***P < 0.001; n.s., no significance; N.D., nondetectable. MFI mean fluorescence intensity.

