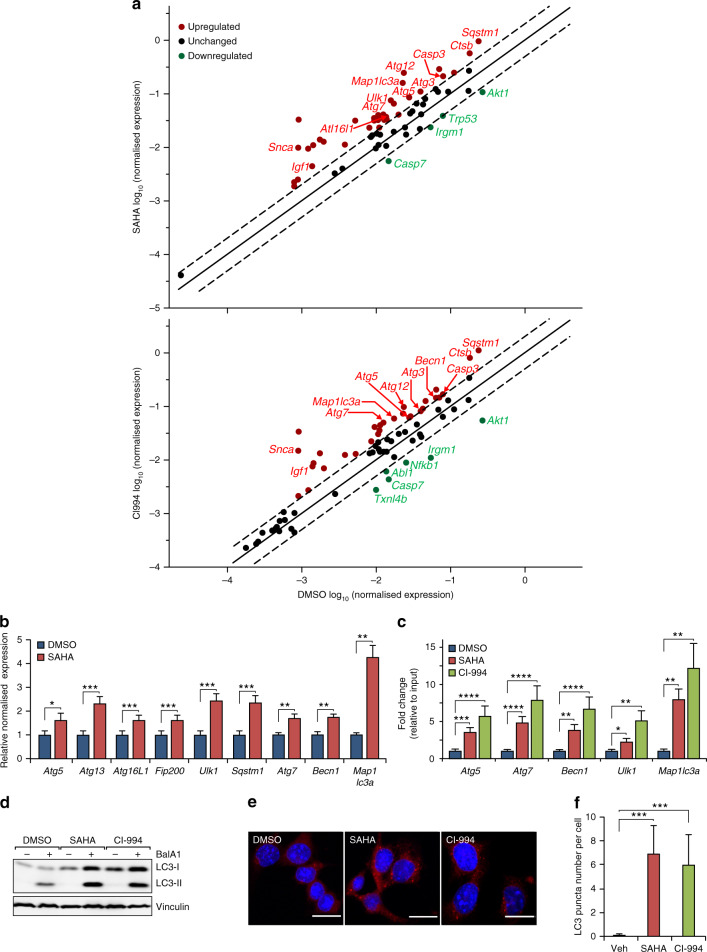
Fig. 3. Autophagy activities are up-regulated by HDAC inhibitor treatment.
a RT-qPCR gene expression analysis of cell death pathways with RT2 Profiler PCR Array Kit (Qiagen) upon SAHA (5 μM), CI994 (25 μM) or DMSO treatment of Tsc1iΔEC tumour cells, with data shown as scatter plot. Fold regulation and significance thresholds were set at 2 and p < 0.05 respectively. b RT-qPCR gene expression analysis of autophagy-related genes shown as mean ± SEM. n = 3, *p < 0.05, **p < 0.01, and ***p < 0.001. c ChIP-qPCR analysis of acetyl-H3K9 binding to the promoters of autophagy-related genes shown as mean ± SEM. n = 3, *p < 0.05, **p < 0.01, ***p < 0.001, and ****p < 0.0001. d Western blot analysis of LC3-I to LC3-II conversion upon SAHA (5 μM), CI994 (25 μM) or DMSO treatment for 24 h with or without bafilomycin A1 (Bal A1, 200 nM) for the final 4 h, with vinculin as an endogenous loading control. e, f Immunofluorescence analysis of LC3 puncta in Tsc1iΔEC upon SAHA (5 μM), CI994 (25 μM) or DMSO treatment for 24 h. Representative images are shown (e). Scale bar, 20 μm. Graph shows LC3 puncta number per cell (f) as mean ± SD. ***P < 0.001.

