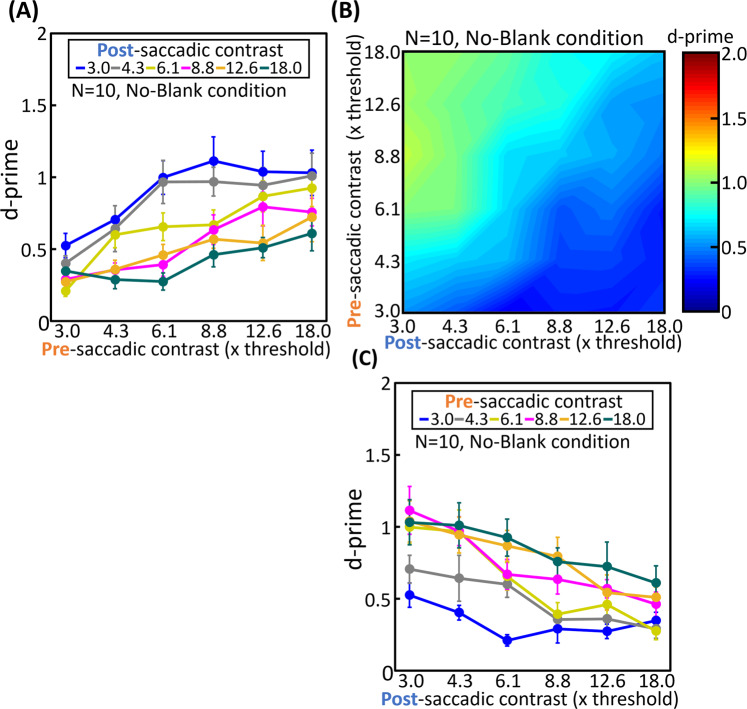
Figure 1.
Influence of pre- and post-saccadic target contrast on displacement detection sensitivity under no-blank condition. Observers reported the direction of a target displacement across a saccade (left or right). Pre- and post-saccadic target contrasts were varied independently. d’ was calculated for each contrast condition as an indicator of the displacement detection sensitivity. (A) Average d’ as a function of pre-saccadic contrast. Each curve corresponds to different post-saccadic contrast conditions. The error bars represent S.E.M. (B) Heat map of average d’ in each contrast condition. The vertical axis indicates pre-saccadic contrast and the horizontal axis indicates post-saccadic contrast. (C) Average d’ as a function of post-saccadic contrast. Each curve corresponds to different pre-saccadic contrast conditions. The error bars represent S.E.M.

