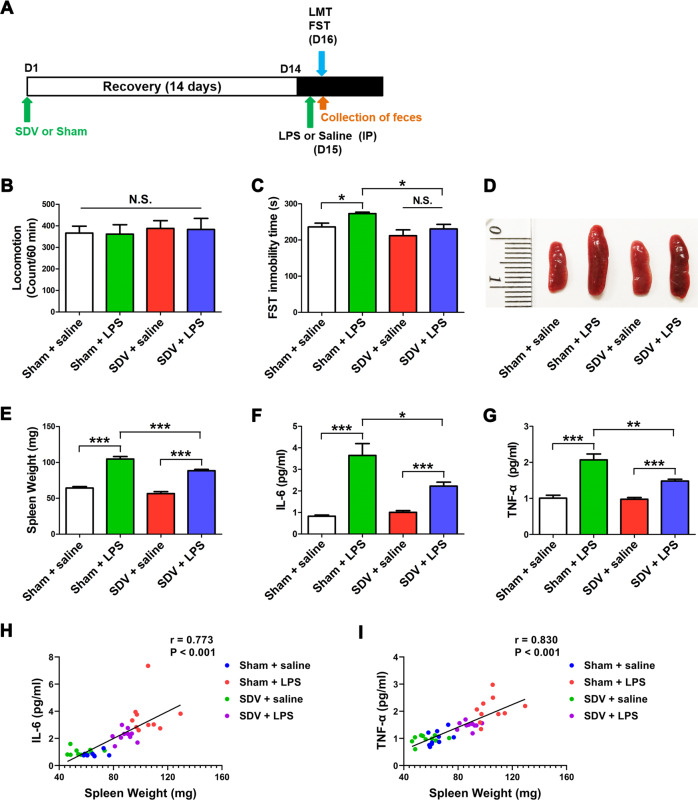
Fig. 1. Effects of SDV on depression-like phenotype, spleen weight and inflammatory cytokines after LPS treatment.
a Treatment schedule. Adult mice were subjected to subdiaphragmatic vagotomy (SDV) and then allowed to recovery for 14 days. On day 15, mice were intraperitoneally (i.p.) injected with lipopolysaccharides (LPS, 0.5 mg/kg) or saline (10 ml/kg). On day 16, fresh feces were collected. Locomotion test and forced swimming test (FST) were performed 22 and 24 h after a single injection of saline or LPS. Blood and brain samples (prefrontal cortex) were collected after behavioral tests (b) Locomotion test (LMT). (tow-way ANOVA: LPS: F1,36 = 0.014, P = 0.907; SDV: F1,36 = 0.271, P = 0.606; interaction: F1,36 = 0.000, P = 0.996). c FST (two-way ANOVA: LPS: F1,36 = 5.666, P = 0.0243; SDV: F1,36 = 8.126, P = 0.0081; interaction: F1,36 = 0.617, P = 0.439). d Representative picture of spleen. e Spleen weight (two-way ANOVA: LPS: F1,36 = 197.7, P < 0.0001; SDV: F1,36 = 21.84, P < 0.0001; interaction: F1,36 = 2.756, P = 0.106). f Plasma levels of IL-6. (two-way ANOVA: LPS: F1,36 = 58.34, P < 0.0001; SDV: F1,36 = 5.507, P = 0.0253; interaction: F1,36 = 9.131, P = 0.0049). g Plasma levels of TNF-α (two-way ANOVA: LPS: F1,36 = 74.43, P < 0.0001; SDV: F1,36 = 9.243, P = 0.0047; interaction: F1,36 = 9.850, P = 0.0036). The data represent mean ± S.E.M. (n = 10). *P < 0.05, **P < 0.01, ***P < 0.0001; N.S. not significant. h There was a positive correlation (r = 0.773, P < 0.001) between spleen weight and plasma IL-6. i There was a positive correlation (r = 0.830, P < 0.001) between spleen weight and plasma TNF-α.

