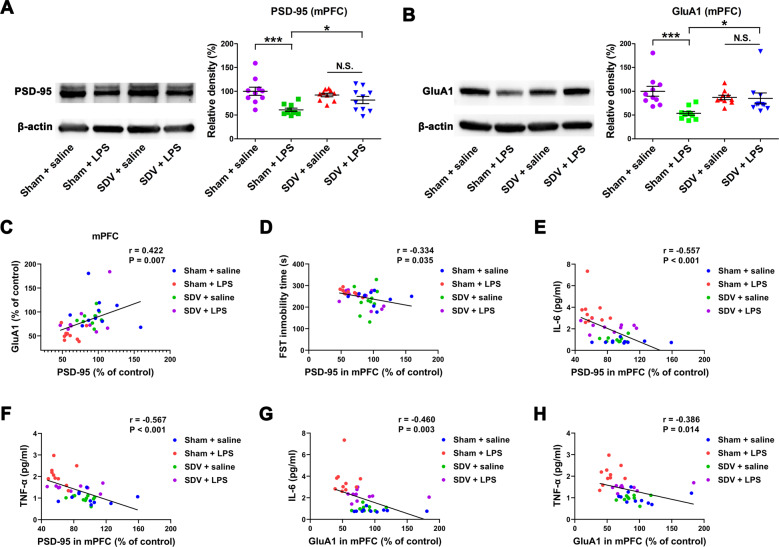
Fig. 2. Effects of SDV on protein expression of PSD-95 and GluA1 in the PFC after LPS treatment.
a Western blot analysis of postsynaptic density-95 (PSD-95) and β-actin in the prefrontal cortex (PFC) of the four groups (two-way ANOVA: LPS: F1,36 = 15.53, P = 0.0004; SDV: F1,36 = 1.028, P = 0.3174; interaction: F1,36 = 9.131, P = 0.0049). b Western blot analysis of AMPA receptor subunit GluR1 (GluA1) and β-actin in the PFC of the four groups (LPS: F1,36 = 8.377, P = 0.0064; SDV: F1,36 = 1.229, P = 0.2749; interaction: F1,36 = 7.055, P = 0.0117). The data represent mean ± S.E.M (n = 10). *P < 0.05, ***P < 0.0001; N.S. not significant. c There was a positive correlation (r = 0.422, P = 0.007) between PSD-95 and GluA1. d There was a negative correlation (r = −0.334, P = 0.035) between FST immobility time and PSD-95 in the PFC. e There was a negative correlation (r = −0.557, P < 0.001) between PSD-95 in the PFC with plasma IL-6. f There was a negative correlation (r = −0.567, P < 0.001) between PSD-95 in the PFC and plasma TNF-α. g There was a negative correlation (r = −0.460, P = 0.003) between GluA1 in the PFC and plasma IL-6. h There was a negative correlation (r = −0.386, P = 0.014) between GluA1 in the PFC and plasma TNF-α.

