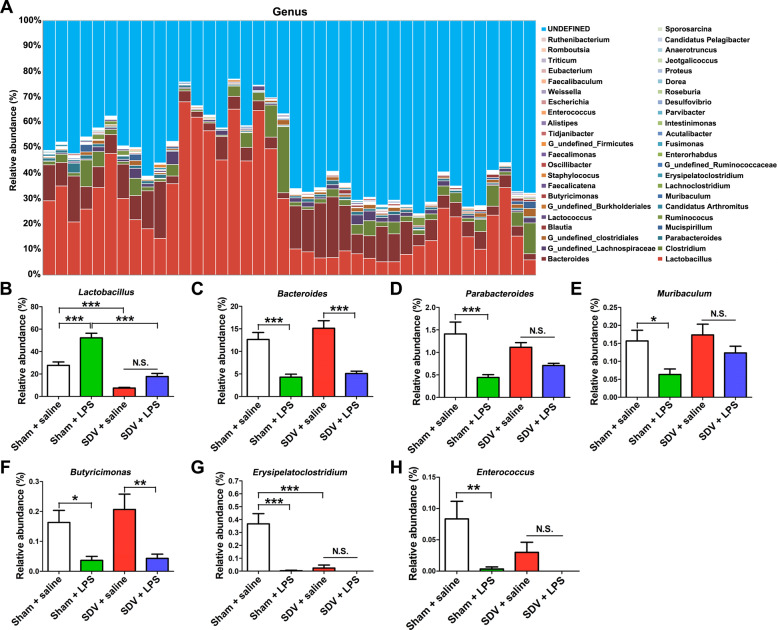
Fig. 5. Altered gut bacteria composition at the genus level.
a Relative abundance at the genus level in the four groups. bLactobacillus (two-way ANOVA: LPS: F1,36 = 34.85, P < 0.0001; SDV: F1,36 = 85.80, P < 0.0001; interaction: F1,36 = 5.862, P = 0.0206). cBacteroides (two-way ANOVA: LPS: F1,36 = 57.36, P < 0.0001; SDV: F1,36 = 1.833, P = 0.1842; interaction: F1,36 = 0.483, P = 0.4917). dParabacteroides (two-way ANOVA: LPS: F1,36 = 21.64, P < 0.0001; SDV: F1,36 = 0.010, P = 0.9194; interaction: F1,36 = 3.659, P = 0.0637). eMuribaculum (two-way ANOVA: LPS: F1,36 = 8.636, P = 0.0057; SDV: F1,36 = 2.471, P = 0.1247; interaction: F1,36 = 0.789, P = 0.3802). fButyricimonas (two-way ANOVA: LPS: F1,36 = 18.24, P = 0.0001; SDV: F1,36 = 0.542, P = 0.4663; interaction: F1,36 = 0.292, P = 0.5925). gErysipelatoclostridium (two-way ANOVA: LPS: F1,36 = 22.22, P < 0.0001; SDV: F1,36 = 17.86, P = 0.0002; interaction: F1,36 = 17.18, P = 0.0002). hEnterococcus (two-way ANOVA: LPS: F1,36 = 11.36, P = 0.0018; SDV: F1,36 = 3.014, P < 0.0911; interaction: F1,36 = 2.346, P = 0.1343). The data represent mean ± S.E.M. (n = 10). *P < 0.05, **P < 0.01, ***P < 0.0001; N.S. not significant.

