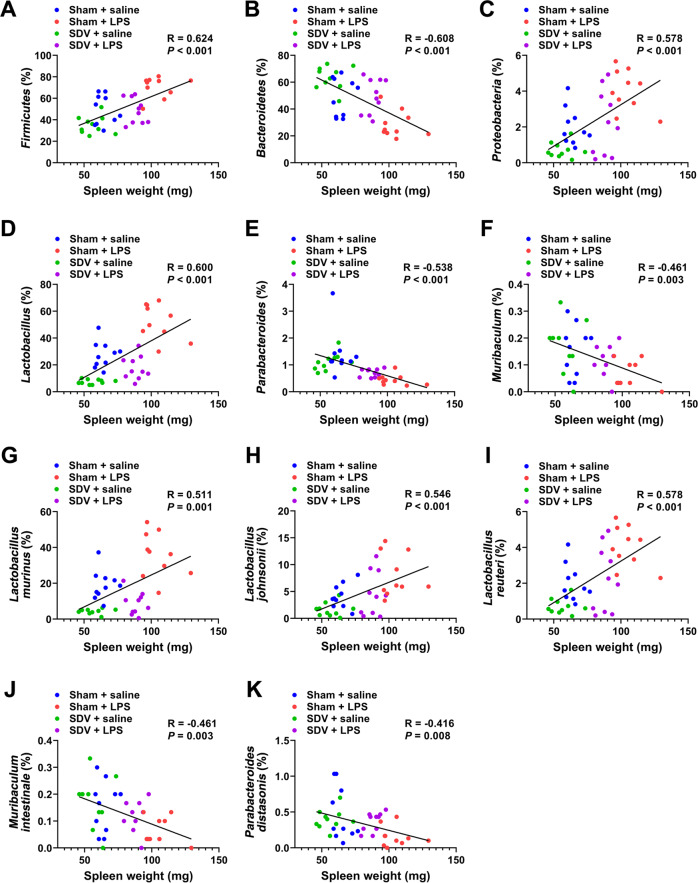
Fig. 7. Pearson correlation analysis of spleen weight and gut microbiota.
There was a positive correlation between spleen weight and Firmicutes (r = 0.624, P < 0.001) (a), Proteobacteria (r = 0.578, P < 0.001) (c), Lactobacillus (r = 0.600, P < 0.001) (d), Lactobacillus murinus (r = 0.511, P = 0.001) (g), Lactobacillus johnsonii (r = 0.546, P < 0.001) (h), Lactobacillus reuteri (r = 0.578, P < 0.001) (i). There was a negative correlation between spleen weight and Bacteroidetes (r = −0.608, P < 0.001) (b), Parabacteroides (r = −0.538, P < 0.001) (e), Muribaculum (r = −0.461, P = 0.003) (f), Muribaculum intestinale (r = −0.461, P = 0.003) (j), Parabacteroides distasonis (r = −0.416, P = 0.008) (k).

