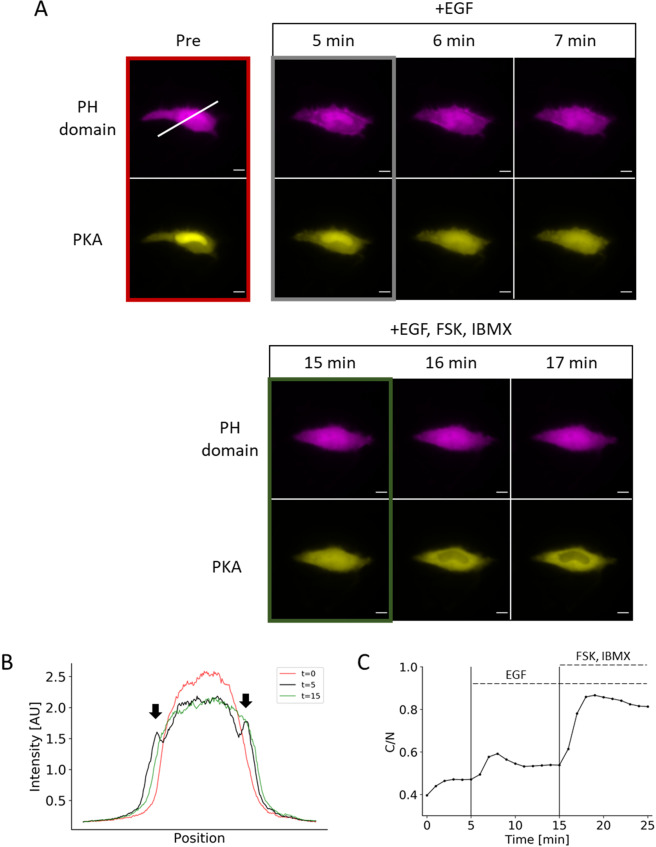
Figure 5.
Duplex monitoring of PIP3 and PKA in a single cell. (A) Representative images show PIP3 accumulation (as indicated by translocation of PH domain) and PKA activity in a single cell after EGF treatment followed by PKA activation. (B) Line-scan of the image in Fig. 4A (white line) shows the transient appearance of enriched fluorescent signal at the plasma membrane (arrows). (C) Response profile shows the normalized signal change that results from EGF stimulation followed by a saturation of the reporter response with forskolin and IBMX cocktail. Data points represent measurement from a single cell. Scale bar represents 10 µm.

