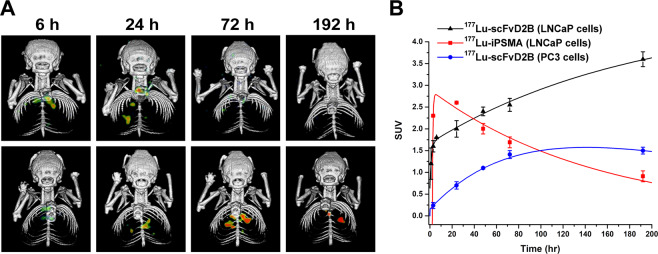
Figure 6.
(A) SPECT/CT images of mice bearing LNCaP lung microtumors collected at different time points after injection of 37 MBq dose of 177Lu-iPSMA (upper panels) and 177Lu-scFvD2B (lower panels). Images are representative of one out three mice selected for each group. (B) 177Lu-scFvD2B and 177Lu-iPSMA tumor kinetic curves obtained from the pulmonary microtumors data. CT and SPECT single images, as well as axial and sagittal sections displaying the microtumor locations of each mouse, are shown in Supplementary Information (see Figs. S9–S32).

