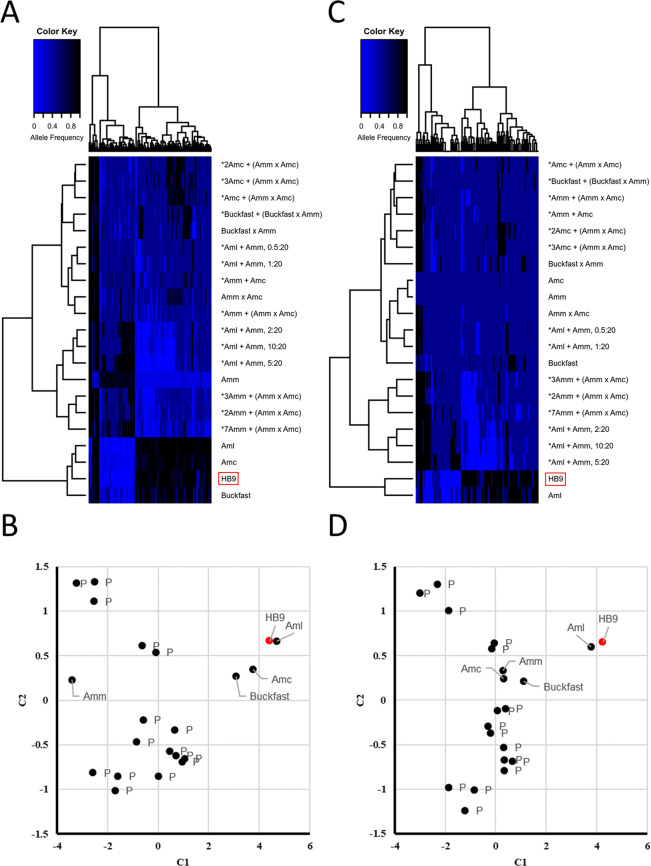
Figure 5.
Hierarchical clustering (HCLUST) and multidimensional scaling (MDS; C1, component 1; C2, component 2) based on regular allele frequencies of the analysed honey bee populations and samples. (A) HCLUST and (B) MDS based on regular allele; (C) HCLUST and (D) MDS based on allele frequencies coded as 0/0.5/1. Names are as follows: Amm, Apis mellifera mellifera; Amc, Apis mellifera carnica; Aml, Apis mellifera ligustica. The star symbols indicate hybrids populations and DNA pools (P), with related dilution ratio, as reported in the original paper by Muñoz et al.60. The honey sample HB9 is highlighted in red.

