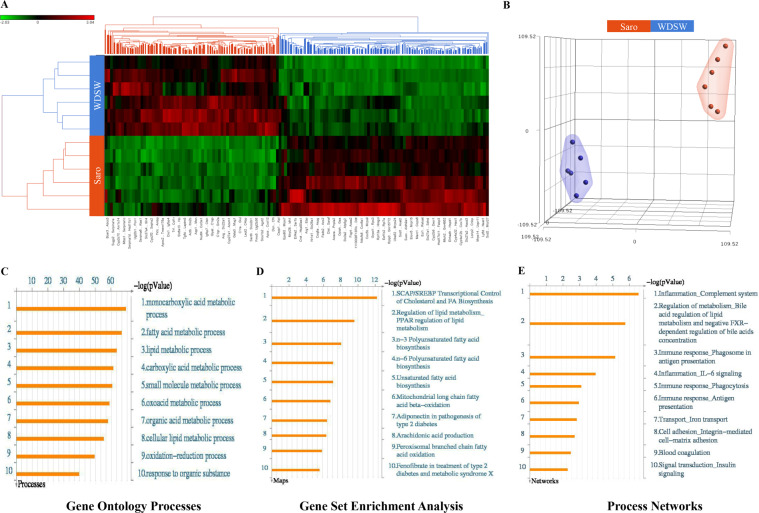
Figure 6.
Hepatic gene expression data set in saroglitazar treated DIAMOND mice. Transcriptomic analysis was performed on liver tissues from saroglitazar treated mice fed with CDNW or WDSW for 12 weeks. The data are presented as (A) heat map demonstrating differentially expressed genes. Red and green colors indicate high and low gene expression, respectively, (B) t-SNE plots showing well segregated saroglitazar and WDSW groups, (C) Gene ontology (GO) processes; (D) Gene set Enrichment Analysis (GSEA); and (E) Process Networks analysis in saroglitazar treated mice versus untreated mice on WDSW. The top rank ordered processes, maps and networks are based on statistical significance.

