Figure 1.
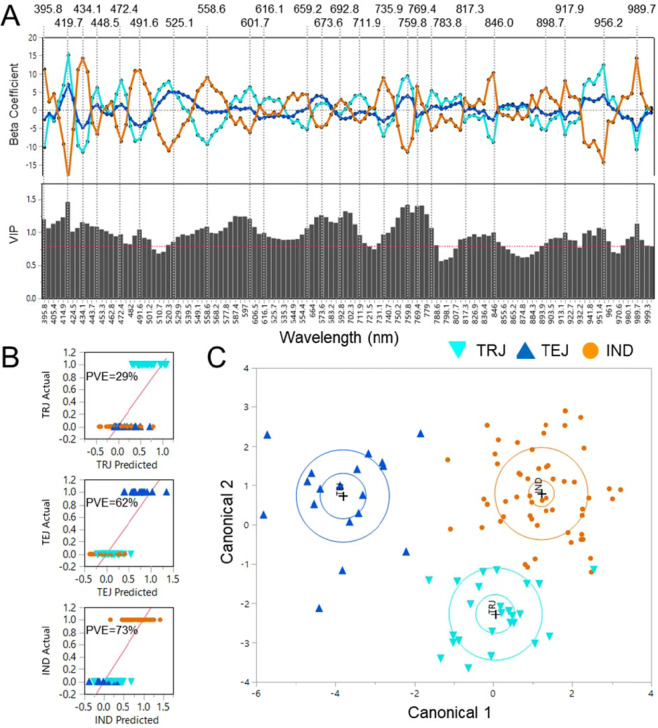
Regression beta coefficient and variable importance plot (VIP) of PLS-DA models that discriminate TRJ (cyan), TEJ (blue), and IND (orange) using centered and scaled Vis/NIR spectra with 24 selected predictive wavelengths indicated (A). Population classification of TRJ, TEJ, and IND using PLS-DA models and percent variance explained (PVE) for each population (B). Canonical plot for linear discriminant analysis of TRJ, TEJ, and IND using the 24 predictive wavelengths selected from the PLS-DA model (C).

