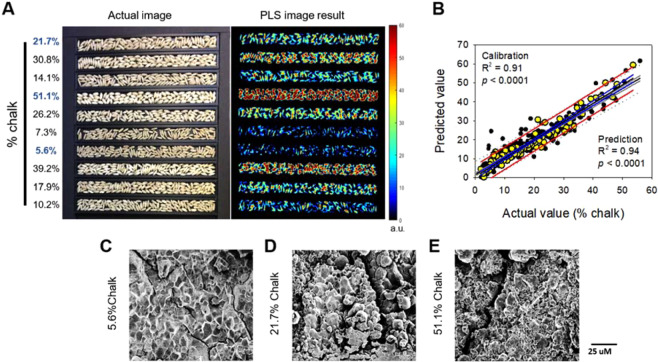
Figure 5.
PLS image of a subset of KZ-RILs with diverse levels of grain chalk (A), linear regression of predicted values of a PLS-DA model using the 702–922 nm range as a function of actual % chalk observed in brown rice of the KZ-RIL population (B), and scanning electron microscope (SEM) images of low (C), intermediate (D), and high chalk KZ-RILs (E). a.u. in (A) stands for arbitrary unit. Black and yellow dots in (B) display calibrated and predicted values, respectively. Grey dotted line/red solid line, grey solid line/blue solid line, and black lines in (B) represent 95% prediction and confidence bands and regression of calibrated/predicted values, respectively.

