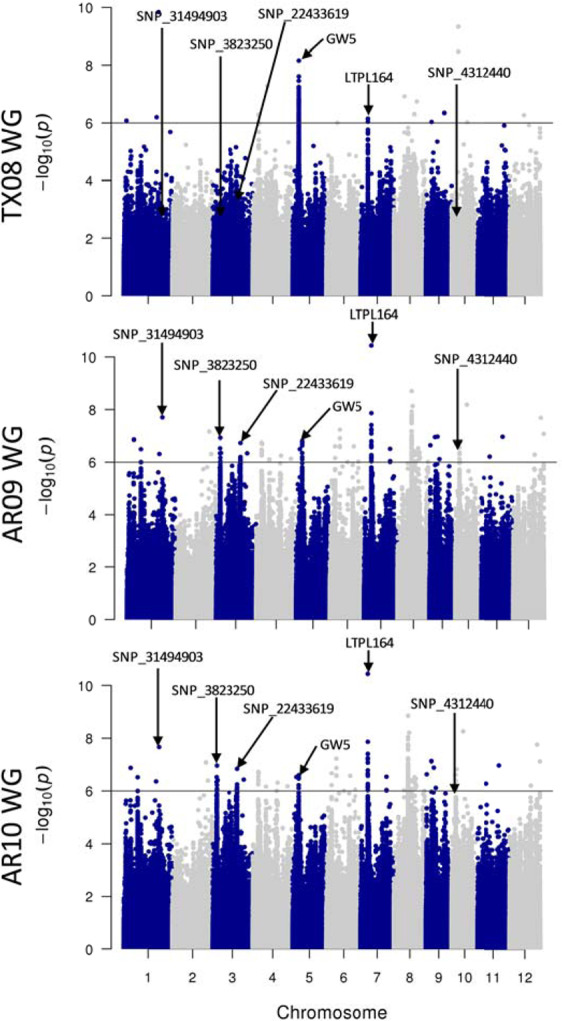
Figure 6.

Manhattan plots for GWAS of the first principal component for the hyperspectral region 707–922 nm for environments TX08, AR09 and AR10. Only non-pigmented bran accessions are presented in this analysis. The x-axis displays chromosome pseudomolecule coordinates and the y-axis displays the –log10(p) value for each SNP across chromosomes. The dark horizontal line represents the genome-wide significance threshold. The labeled SNPs are discussed as potential candidates in the text. GW5 – grain weight 5 gene; LTPL164 – Protease inhibitor/seed storage gene.
