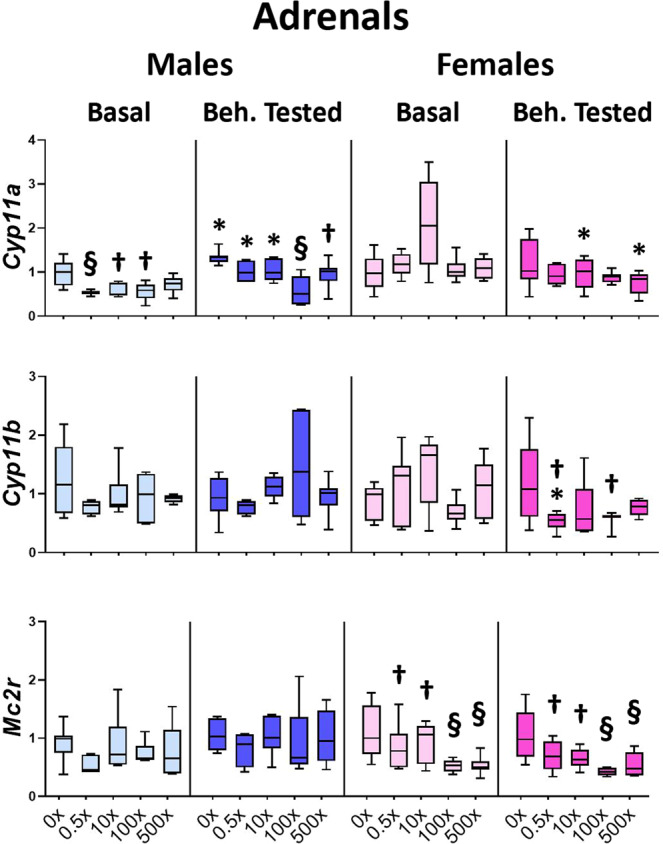
Figure 6.

Effect of mixture N1 on adrenal gene expression of adult male (blue bars) and female (magenta bars) mice in utero exposed to 0.5×, 10×, 100× and 500× SELMA mothers’ levels of mixture N1 or the vehicle (0×). Light colored bars show gene expression under basal conditions (Basal) and darkly colored bars the gene expression of matched siblings that underwent the behavioral tests (Beh. Tested). Expression levels of indicated genes were evaluated by qRT-PCR and normalized to b-actin. Box plots encompassing values from the 25th to 75th percentile of the data. The horizontal line in the box shows the median value, whereas the horizontal lines above and below the box show the maximal and minimal values, respectively. Three-Way ANOVA with Dunnett’s post hoc test. Significance was accepted for P < 0.05. Significance is shown for the effect of mixture vs. the respective (Basal or Beh. Tested) control. †0.01 < P < 0.05, §P < 0.001 as well as for the effect of Beh. Testing vs. the respective Basal group *P < 0.05. Detailed statistics are provided in Supplemental Tables S6 & S6.1.
