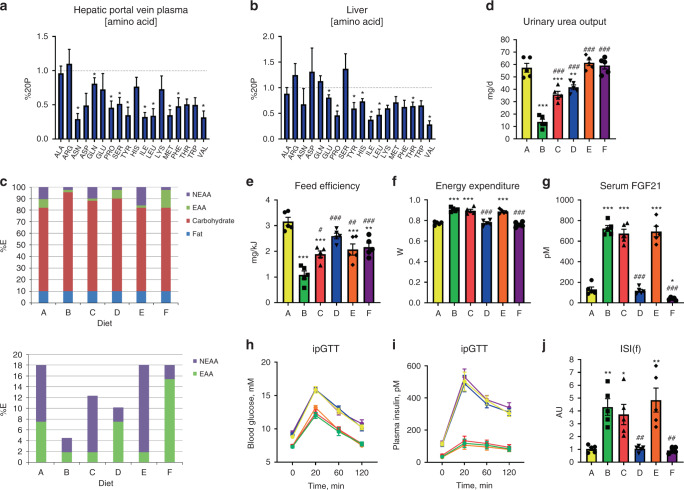
Fig. 2. Dietary essential amino acid restriction, independent from non-essential amino acid or carbohydrate supply, dictates the systemic metabolic response to dietary protein dilution.
a Hepatic portal vein amino acid levels in response to refeeding a low-protein diet following a week of diet adaptation. Data (mean and SEM) are represented as a proportion of the control group fed a normal protein diet (20%P). n = 5/group derived from samples of individual mice. Data were analysed by Student’s t-test. Different than 20%P, *P < 0.05. b Liver tissue amino acid levels in response to refeeding a low-protein diet following a week of diet adaptation. Data are represented as a proportion of the control group fed a normal protein diet (20%P). n = 5/group derived from samples of individual mice. Data were analysed by Student’s t-test. Different than 20%P, *P < 0.05. c Nutrient source breakdown as % contribution to total energy for the experimental groups. EAA: essential amino acids. NEAA: non-essential amino acids. d Urinary urea output of mice in response to a 3-week treatment with diets as per the protocol of SF1A containing nutrient energy sources as in (c). Data are mean and SEM; n = 5 individual mice per group. Data were analysed by one-way ANOVA with Holm–Sidak post-hoc tests. Different than 20P: *P < 0.05, **P < 0.01, ***P < 0.001. Different than 5P: #P < 0.05, ##P < 0.01, ###P < 0.001. e Feed efficiency of mice as in (d). f Energy expenditure of mice as in (d). g Serum fibroblast growth factor 21 (FGF21) levels of mice as in (d). h Blood glucose levels during an intraperitoneal glucose tolerance test (ipGTT) of mice as in (d). i Plasma insulin levels during an intraperitoneal glucose tolerance test (ipGTT) of mice as in (d). j Insulin sensitivity index during fasting (ISI(f)) of mice as in (d).

